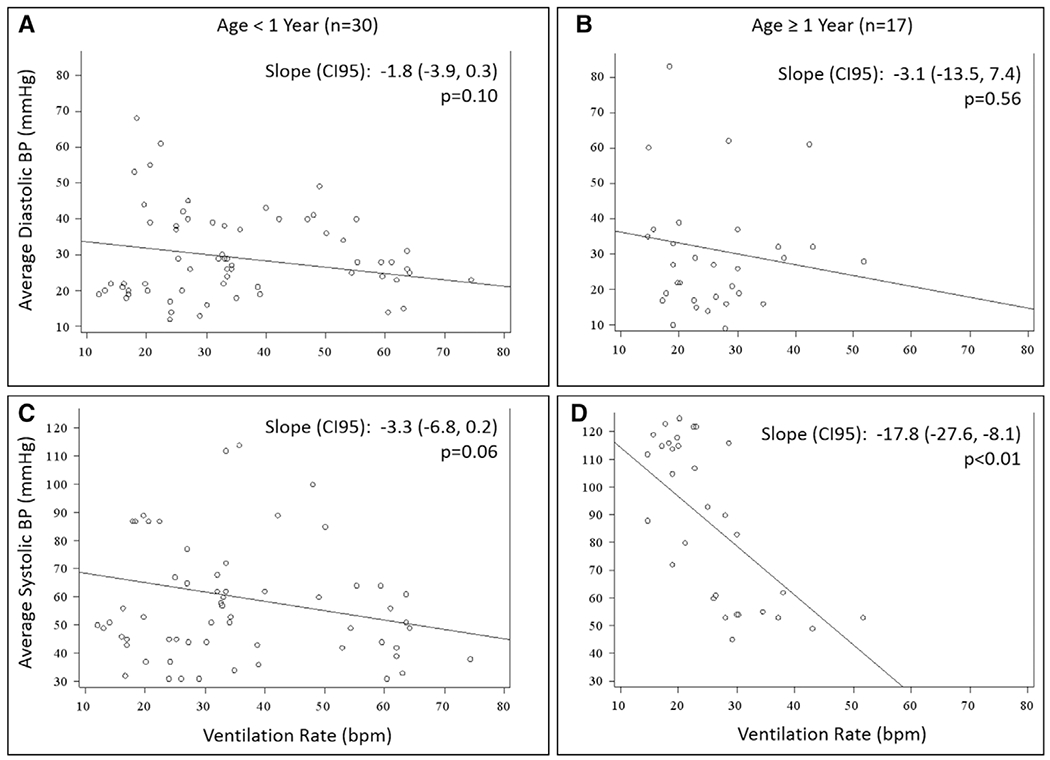
Figure 1.

Scatterplot of minute-level average ventilation rates versus diastolic (A and B) and systolic (C and D) blood pressures (BPs). Children less than 1 yr old (A and C), and older children greater than or equal to 1 yr old (B and D). Estimates for slope represent change in BP for each 10 breaths/min (bpm) increase in ventilation rate. All estimates from generalized estimating equations to control for minutes within a cardiopulmonary resuscitation event for the same patient.
