Fig. 4.
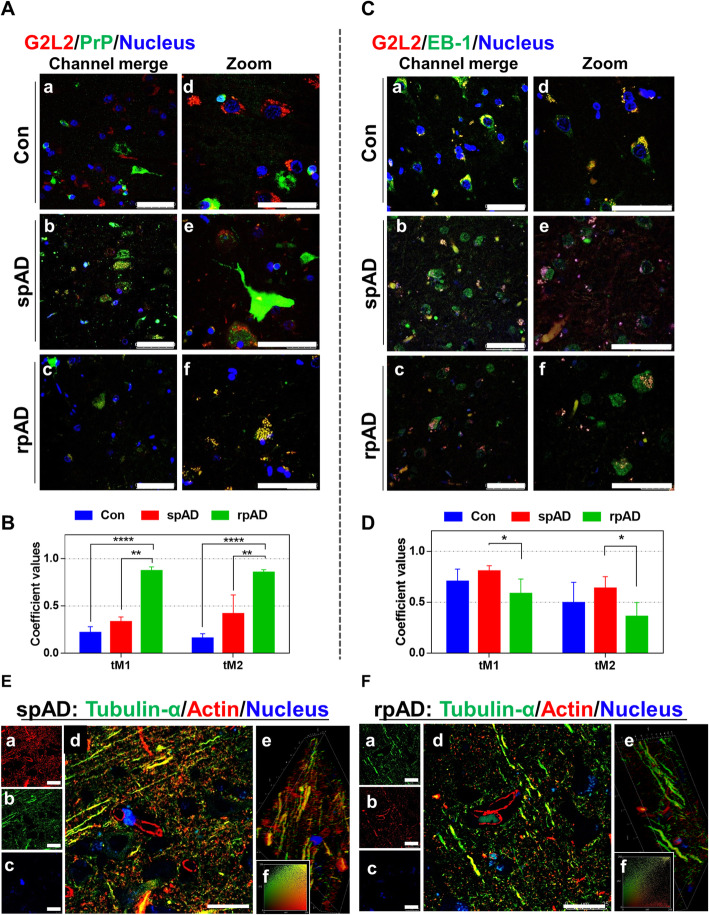
Neuronal co-localization of G2L2 and HDP effects G2L2 / EB-1 binding and cytoskeletal integrity in the rpAD brain cortex. A) Representative photomicrographs (panels Aa-Af) from frontal cortex sections of rpAD, spAD and controls stained with anti-G2L2 and anti-PrP (SAF70) antibodies. Highest co-localization of G2L2 and PrP was observed in frontal cortex sections from rpAD, followed by spAD and controls. B) Threshold Mander’s coefficient values for the overlap of G2L2 channel pixels to PrP channel pixels (tM1) were significantly higher in rpAD than in spAD. The average tM2 (Mander’s coefficient for the overlap of PrP channel pixels to G2L2 channel pixels) was also significantly higher in rpAD than that of spAD. C) Representative frontal cortex sections of rpAD, spAD and controls stained for G2L2 and EB-1 (panels Ca-Cf) show lowest G2L2/EB-1 co-localization in rpAD frontal cortex sections followed by those of spAD and control, respectively. D) Significantly decreased tM1 (G2L2) and tM2 (EB-1) values were seen in rpAD compared with spAD and Con sections. Statistical significance was calculated with one-way ANOVA followed by Tukey’s post-hoc test. *p < 0.05; **p < 0.005; ***p < 0.001. E&F) Representative micrographs of spAD (E) and rpAD (F) sections stained using anti-α-tubulin and anti-β-actin antibodies are shown. Panels Ea-Ec and Fa-Fc show the single channel images. Panels Ed and Fd show the channel merges. Panels Ee and Fe correspond to the 3D reconstructions from z-stacks of spAD and rpAD, respectively. Insets Ef and Ff show representative IC plots. Relatively stronger actin/tubulin co-localization was observed in spAD compared with rpAD patients. Confocal images were scanned from the frontal cortex sections of spAD (n = 5), rpAD (n = 5) and controls (n = 5). Scale bars in panels A&C = 50 μm; in panels E&F = 25 μm

