
Fig. 6. Untargeted metabolomics reveals tryptophan metabolites as potent radioprotectants.
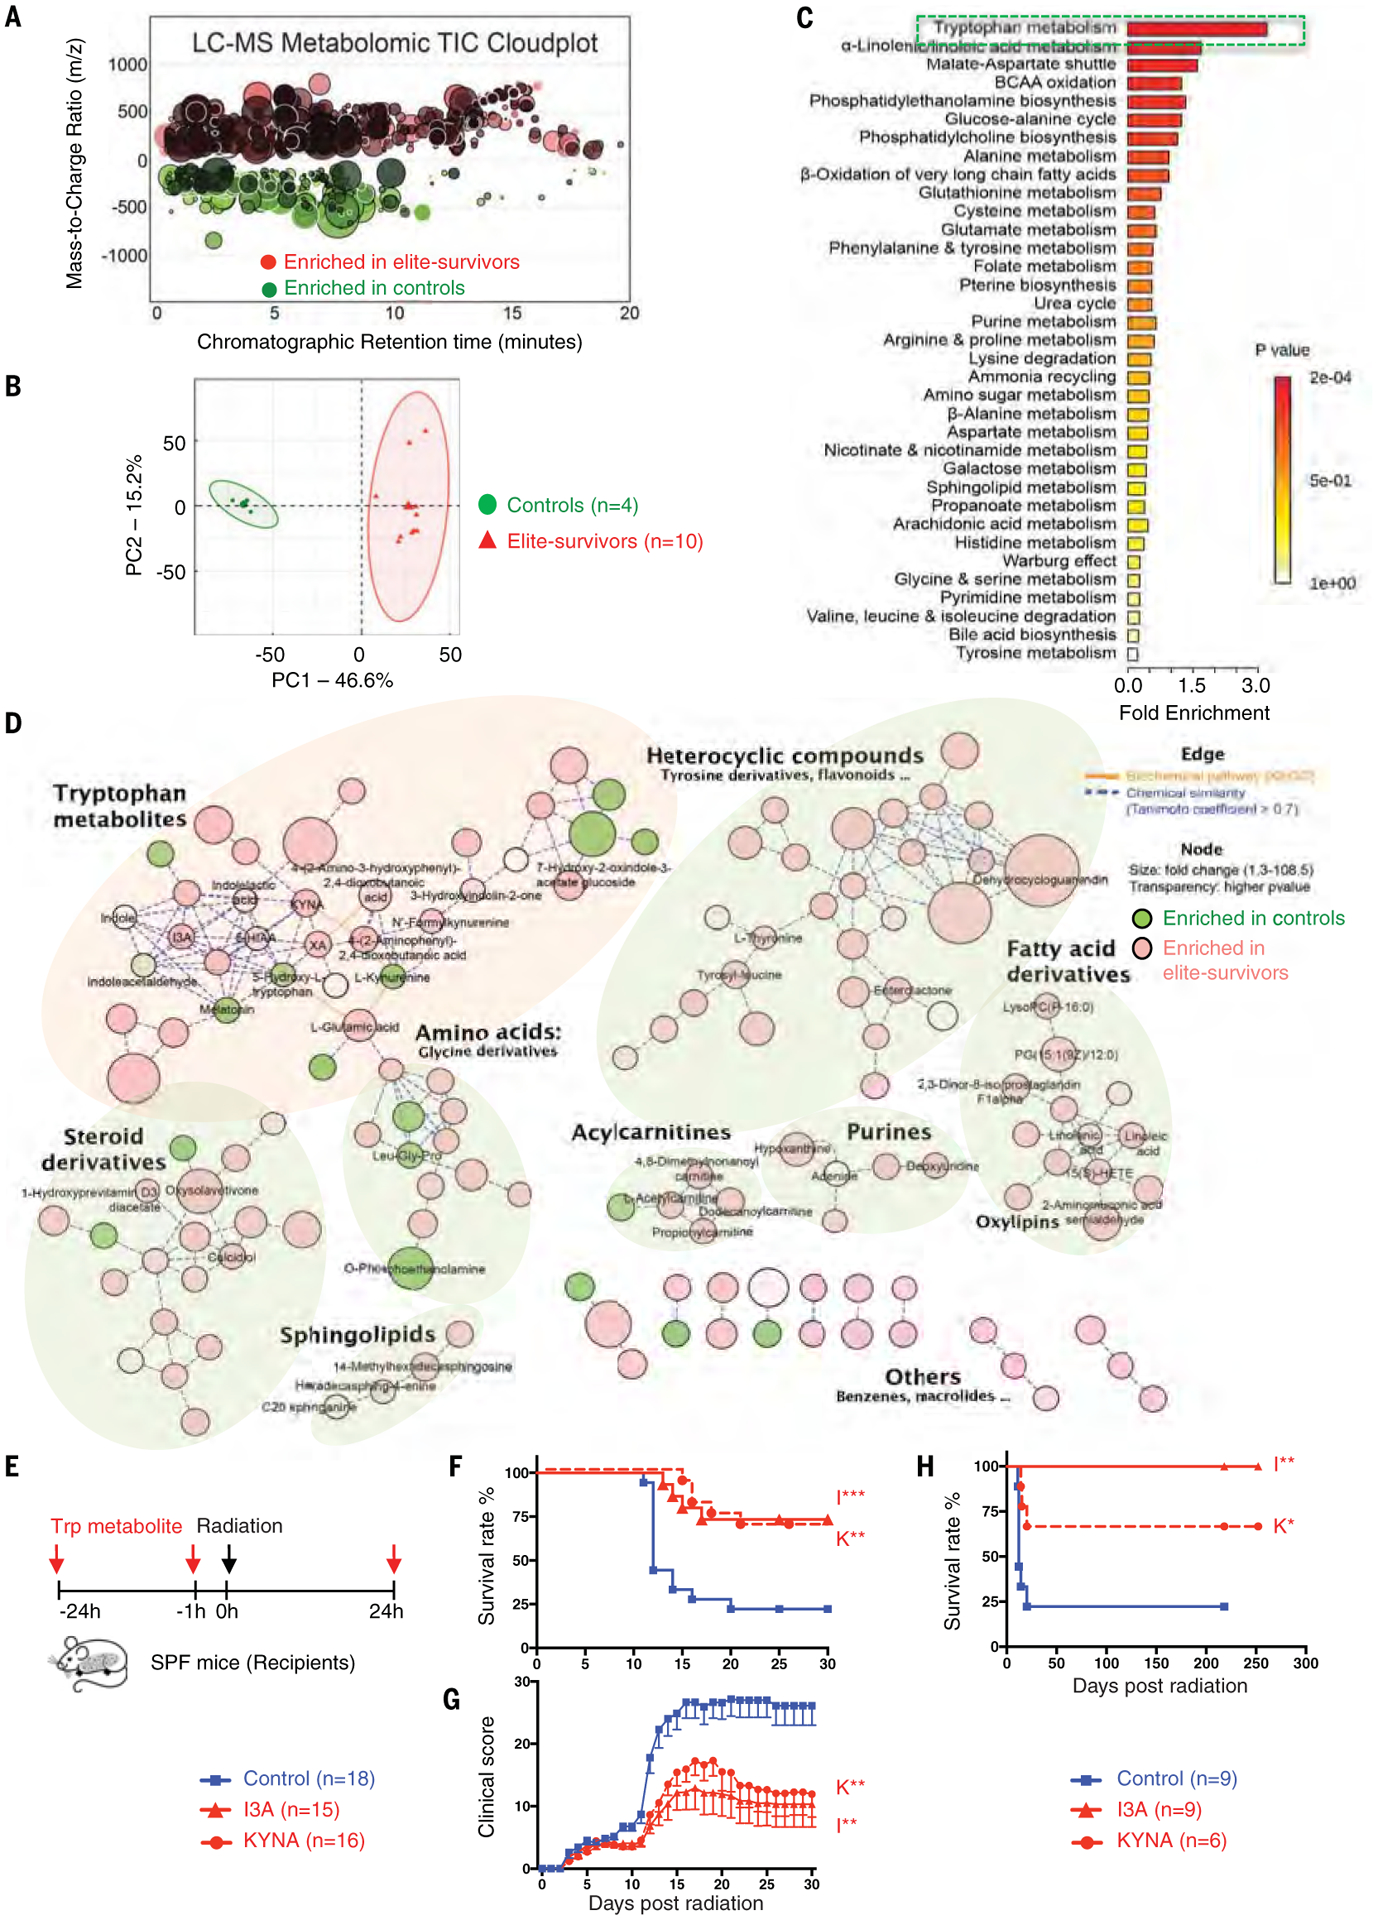
Metabolite profiles were measured in fecal samples of elite-survivors and control mice at day 290 after total body radiation. (A and B) Total ion chromatogram metabolomic cloudplot (P < 0.01) (A) and PCA plot (B) of fecal metabolites. (C) Metabolite set enrichment analysis identified and interpreted metabolites in biochemical contexts. (D) Metabolic network integrated biochemical pathways and chemical relationships of all detected metabolites. Identified metabolites are represented by circular nodes, with lower transparency reflecting lower P values from Welch’s t test. Red nodes, metabolites with higher abundance in elite-survivors; green nodes, those higher in controls. Orange lines connecting metabolites symbolize Kyoto Encyclopedia of Genes and Genomes reactant pair links; green lines symbolize chemical similarity with a Tanimoto coefficient score >0.7. Tryptophan metabolites are highlighted by a pale pink shadow; others are distinguished by pale green shadows. (E) Schematic of tryptophan metabolite treatment. (F and G) Survival rates (F) and clinical scores (G). (H) Long-term survival in tryptophan metabolites compared with control treated groups were monitored for >200 days after radiation. Data are pooled from three [(F) and (G)] or two (H) independent experiments. Error bars indicate SEM, *P < 0.05, **P < 0.01, ***P < 0.001 determined by log-rank (Mantel Cox) test [(F) and (H)] and Mann-Whitney test for AUC (G).