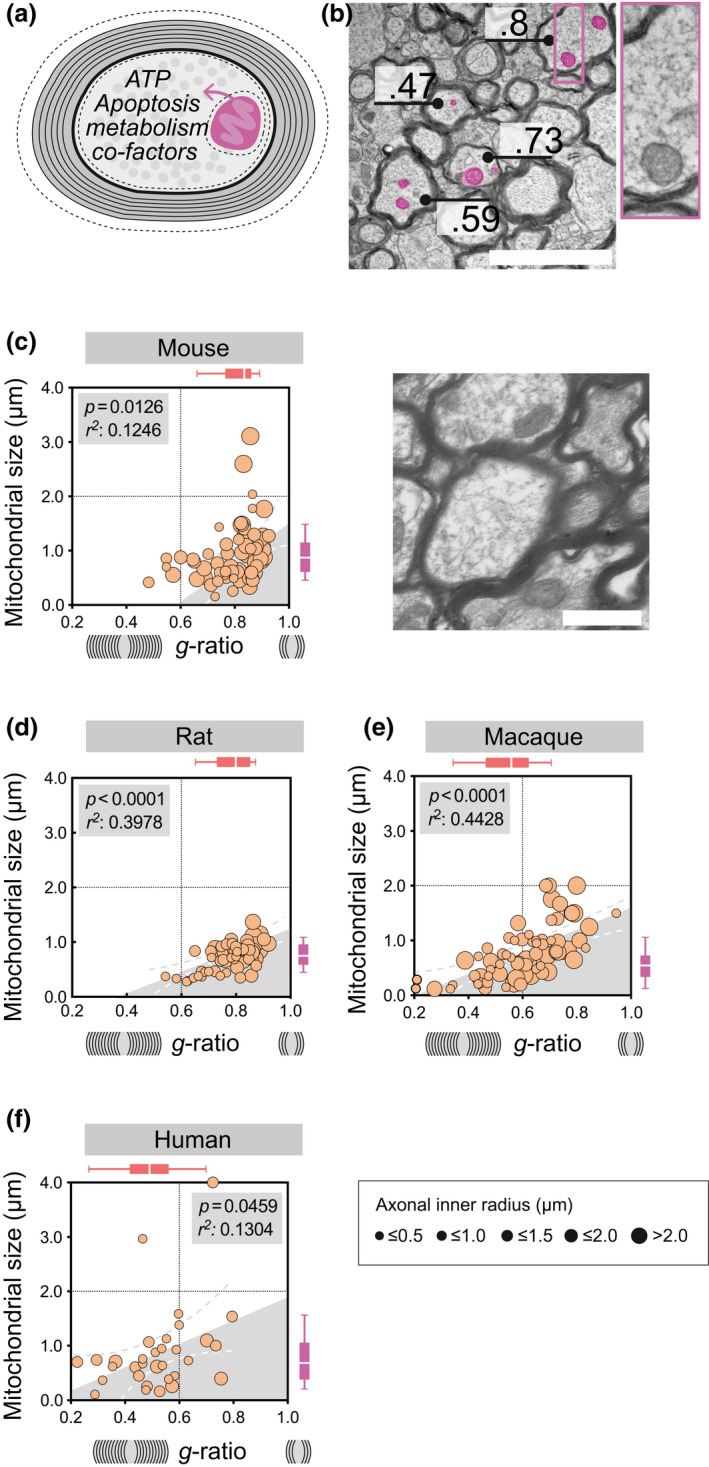
FIGURE 1.

Axonal mitochondrial size correlates with myelin g‐ratio in rodents, macaques, and humans during homeostasis. (a) Illustration of a cross‐sectional myelinated axon with the g‐ratio representing the axonal diameter in relation to the diameter of both the axon and the surrounding myelin. Dashed lines indicate the circumference around the axonal mitochondria, and the inner and outer myelin. (b) Representative transmission electron microscopy (TEM) image with annotated g‐ratio and, exemplified, pseudo‐colored axonal mitochondria in purple (scale‐bar 1 μm). (c) Homeostatic mitochondrial size (μm) and g‐ratio in mouse corpus callosum (n animals = 3 n total axons = 104). Horizontal box plots indicate g‐ratio, vertical box plots indicate mitochondrial size, whiskers illustrate 10–90 percentile, scale‐bar 1 μm. (d) Homeostatic mitochondrial size (μm) and g‐ratio in rat corpus callosum (n animals = 3, n total axons = 61), representative TEM of rat corpus callosum, scale‐bar 2 μm (e) Homeostatic mitochondrial size (μm) and g‐ratio in macaque spinal cord (n animals = 3, n total axons = 72). (f) Homeostatic mitochondrial size (μm) and g‐ratio in human prefrontal cortex (n subjects = 3, n total axons = 32). The diameter of each point of measure indicates the axonal inner radius in μm. All correlation analyses were performed with Pearson's r test [Color figure can be viewed at wileyonlinelibrary.com]
