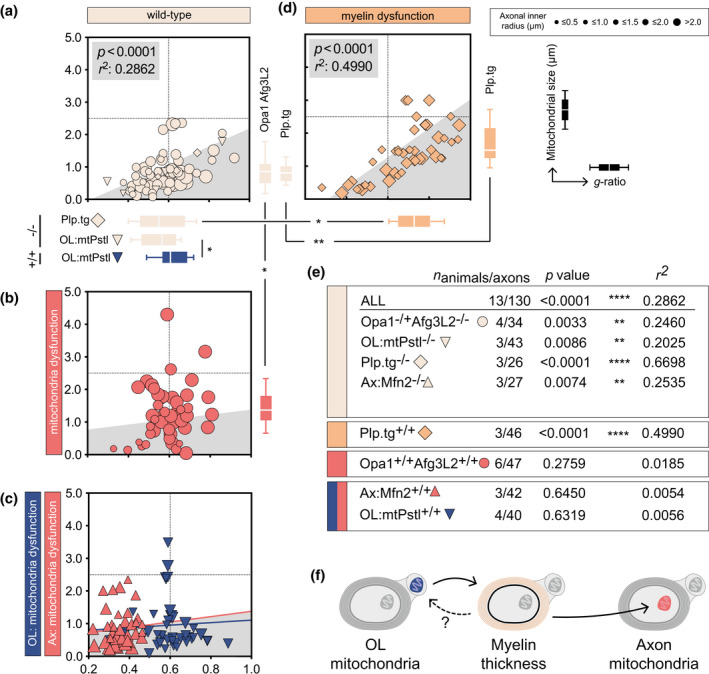
FIGURE 3.

Hypomyelination affects axonal mitochondrial size but not vice versa. (a) Homeostatic mitochondrial size (μm) and g‐ratio in mice with genetically induced mitochondrial dysfunction. Horizontal box plots indicate g‐ratio, vertical box plots indicate mitochondrial size, whiskers illustrate 10–90 percentile. (b) Homeostatic mitochondrial size (μm) and g‐ratio genetically induced mitochondrial dysfunction (n animals = 6, n axons = 47). (c) Homeostatic mitochondrial size (μm) and g‐ratio in Ax:Mfn2+/+ (n animals = 3, n axons = 40) and OL:mtPstI+/+ (n animals = 4, n axons = 40) mice. (d) Homeostatic mitochondrial size (μm) and g‐ratio in Plp.tg+/+ mice (n animals = 3, n axons = 46). (e) Statistical summary of correlation between g‐ratio and axonal mitochondrial size in all mice strains. (f) Schematic illustration of the adaption hierarchy where OL mitochondrial dysfunction influences g‐ratio (i.e., myelin thickness) which in turn influence axonal mitochondrial size. All correlation analyses were performed with Pearson's r test, multiple comparisons of mitochondrial size and g‐ratio in (a–d) were performed using one‐way ANOVA. *p < 0.05, **p < 0.01
