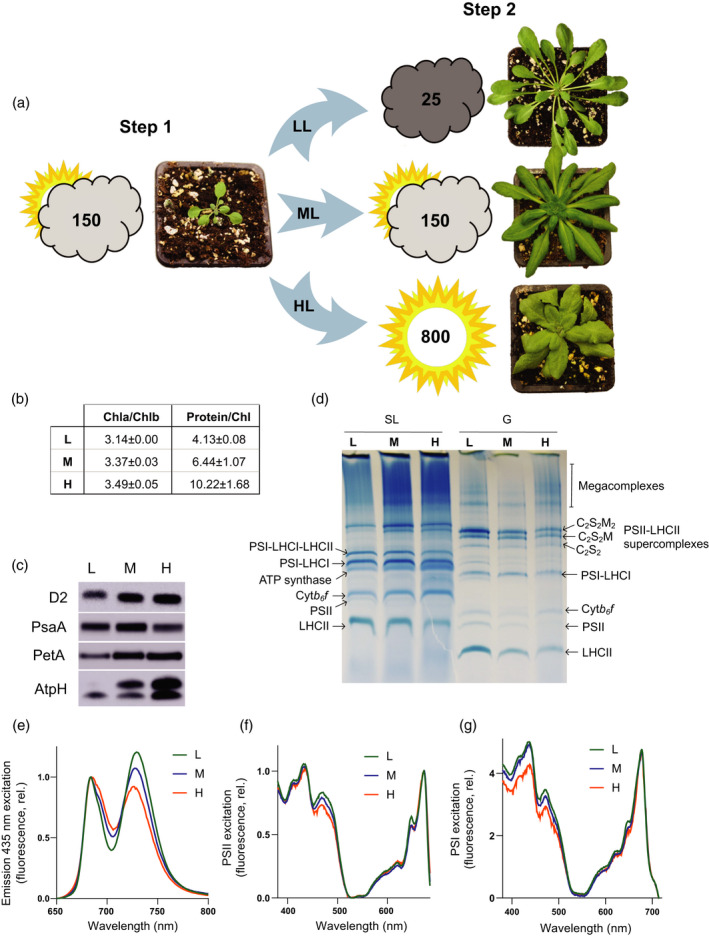
Figure 1.

Arabidopsis plants have different morphologies after acclimation under low, moderate and high light. (a) Plants were initially grown under moderate light (ML, Step 1) at 150 µmol photons m−2 sec−1and then (Step 2) acclimated under low light (LL) at 25 µmol photons m−2 sec−1or high light at 800 µmol photons m−2 sec−1(HL) or maintained under ML conditions (see the Experimental Procedures section). The plants were photographed at 2 weeks post‐Step 1, and post‐Step 2 at 7 (LL), 5 (ML) and 4 (HL) weeks. (b) Ratios of Chl a to Chl b and protein to Chl in isolated thylakoids from LL, ML and HL (n = 3, mean ± SD). (c) Immunodetection of D2 (PSII), PSAA (PSI), PETA (cyt b 6 f) and ATPH (ATP synthase) in Arabidopsis thylakoid membranes acclimated to LL, ML and HL. Sample loading was normalised to chlorophyll. (d) BN‐PAGE of solubilised stromal lamellae (SL) and granal (G) thylakoid fractions. (e) The 77 K fluorescence emission spectra of LL (green), ML (blue) and HL (orange) thylakoids using 435 nm excitation. (f) The 77 K fluorescence excitation spectra of PSII (695 nm) from LL (green), ML (blue) and HL (orange) thylakoids. (g) The 77 K fluorescence excitation spectra of PSI (735 nm) from LL (green), ML (blue) and HL (orange) thylakoids.
