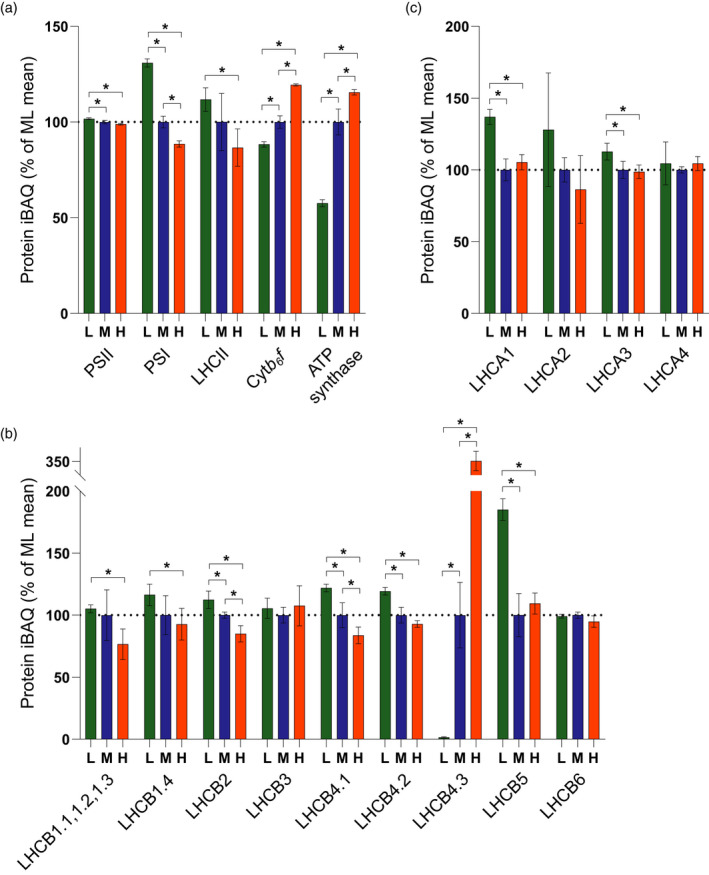
Figure 2.

Relative quantification of the major photosynthetic complexes by mass spectrometry. (a) MS analysis showing the relative abundance in low (L), moderate (M) and high (H) light‐acclimated thylakoids of key photosynthetic complexes PSII, PSI, LHCII, cyt b 6 f and ATP synthase, expressed as a percentage of the mean at ML. The bars represent the average of three independent peptide preparations (n = 3), derived from a pooled thylakoid sample from 15 plants, which were subject to MS analysis in triplicate in a randomised order and the values were averaged. Data are presented as mean ± SD. Significant differences between light conditions were determined by a modified Welch t‐test (* q < 0.05). (b) MS analysis showing the relative abundance of LHCII trimer and minor monomeric PSII antenna subunits. Sampling details are as stated above. (c) MS analysis showing the abundance of LHCI subunits relative to PSI. Sampling details are as stated above.
