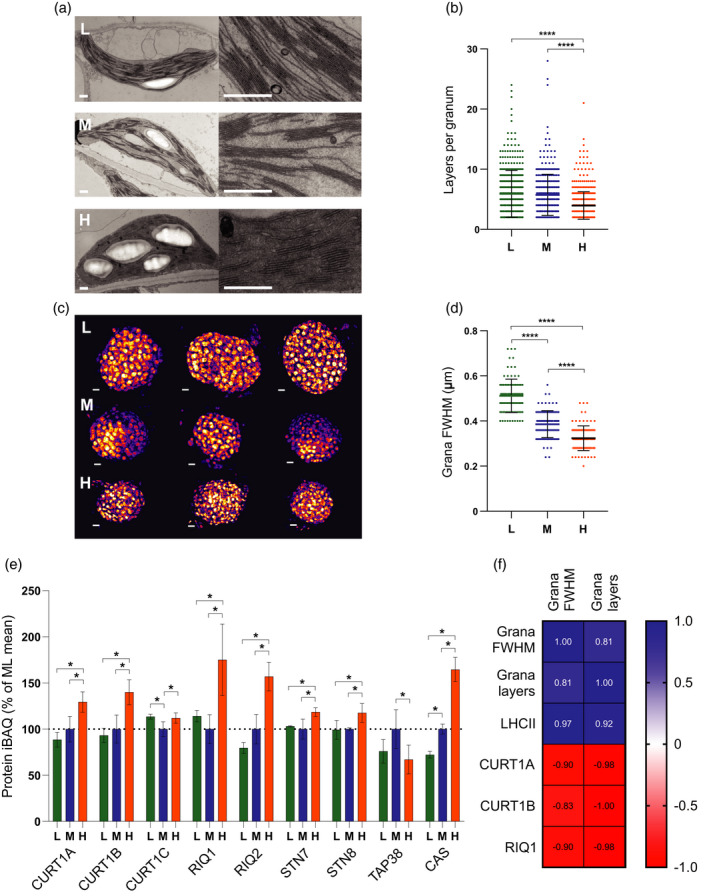
Figure 3.

Assessment of changes in thylakoid membrane grana size during developmental acclimation. (a) Thin section electron micrographs of chloroplasts in plants acclimated to LL (top row, L), ML (middle row, M) and HL (bottom row, H) (scale bar: 0.5 µm). (b) Number of membrane layers per grana stack calculated from electron microscopy images of chloroplasts in LL (n = 379 grana stacks), ML (n = 354) and HL (n = 507) leaves (one‐way anova with Tukey’s multiple comparisons, ****P < 0.0001). Data are presented as mean ± SD. (c) 3D‐SIM images (shown as Max Projections on the z‐axis with tricubic sharp interpolation) of chloroplasts in plants acclimated to LL (top row, L), ML (middle row, M) and HL (bottom row, H) (scale bar: 0.5 µm). (d) Full‐width at half‐maximum (FWHM) fluorescence intensity of the fluorescent spots (grana) in three‐dimensional SIM images of chloroplasts in LL (n = 97), ML (n = 100) and HL (n = 100) leaves (one‐way anova with Tukey’s multiple comparisons, ****P < 0.0001). Data are presented as mean ± SD. (e) MS analysis showing the relative abundance of proteins involved in the modulation of thylakoid membrane architecture, expressed as a percentage of the mean at ML. Sampling details are as stated in Figure 2. (f) Pearson correlation of the mean number of membrane layers per granum and grana FWHM with protein iBAQ values of LHCII trimers, CURT1A, CURT1B and RIQ1. Blue panels indicate a positive correlation while red panels indicate a negative correlation.
