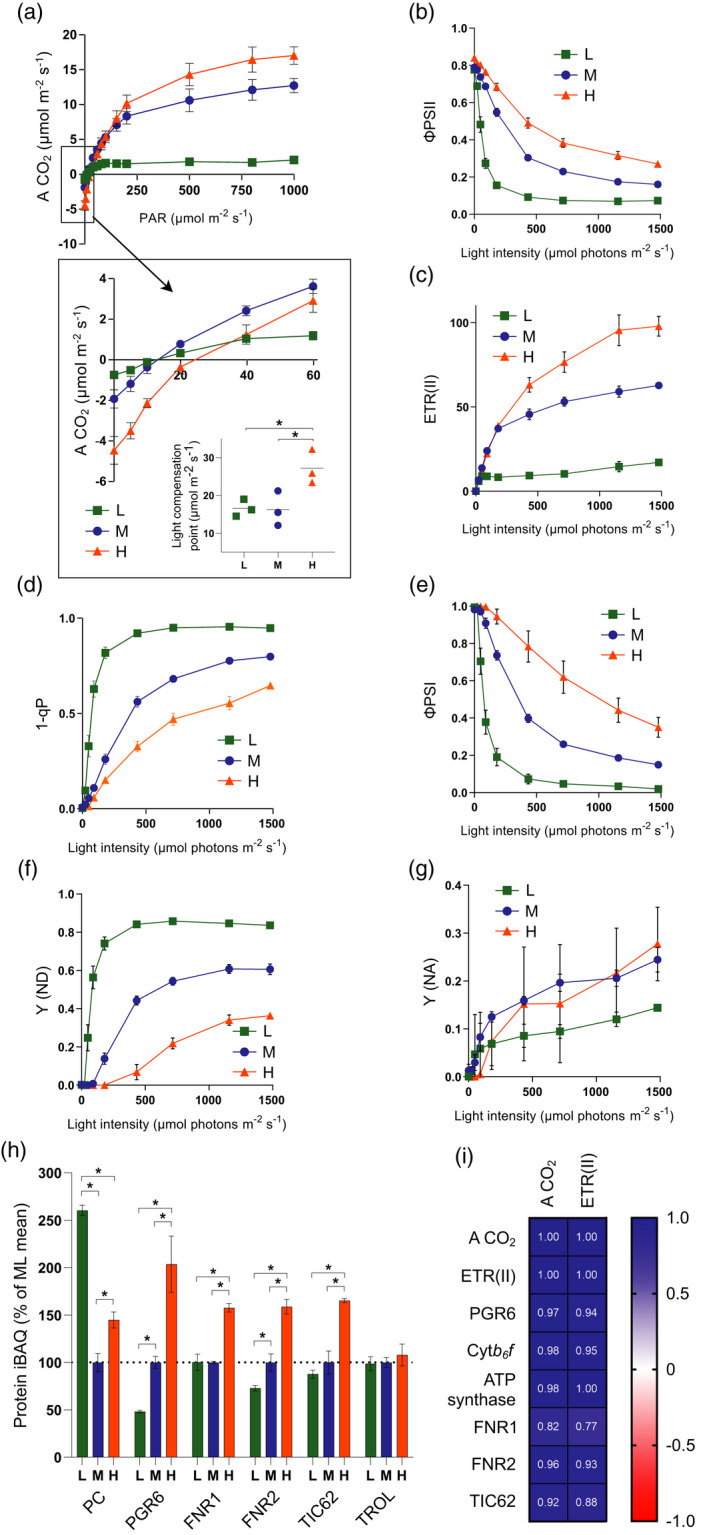
Figure 4.

Assessment of changes in linear electron transfer (LET) capacity and CO2 assimilation during developmental acclimation. (a) A CO2 as a function of light intensity. Inset highlights gas exchange under low light and the calculated light compensation point. (b) PSII light use efficiency (ΦPSII) as a function of light intensity. (c) Estimated electron transfer rate of PSII (ETR(II)) as a function of light intensity. (d) The fraction of closed PSII reaction centres (1 − qP). (e) PSI light use efficiency (ΦPSI) as a function of light intensity. (f) PSI donor side limitation (Y (ND)). (g) PSI donor side limitation (Y (NA)). (h) MS analysis showing the relative abundance of electron transfer proteins, expressed as a percentage of the mean at ML. Sampling details are as stated in Figure 2. (i) Pearson correlation of the maximum A CO2 and ETR(II) with protein iBAQ values of PGR6, cytb 6 f, ATP synthase, FNR1, FNR2 and TIC62. Blue panels indicate a positive correlation while red panels indicate a negative correlation. For (a–g), HL = orange, ML = blue, LL = green. n = 4, with the exception of (a), where n = 3. Asterisks denote significance (one‐way anova with Tukey’s multiple comparisons, *P < 0.05). Error bars denote SEM.
