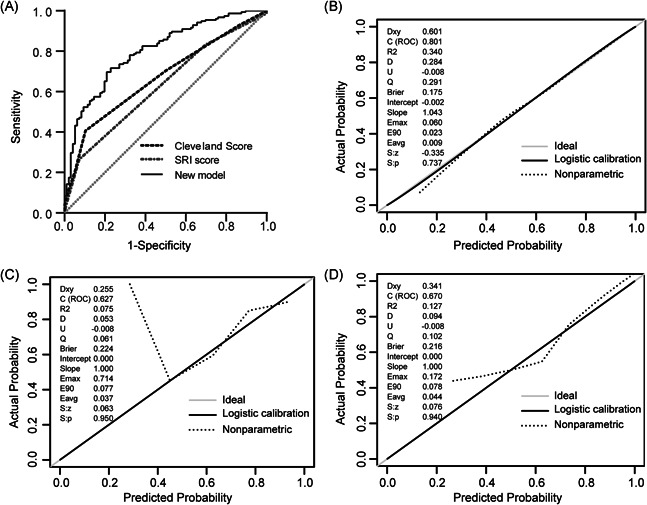
Figure 4.

The AUC and calibration curves for models in the validation set. (A) Comparison of AUC among models for postoperative AKI. New model AUC: 0.801 (0.746–0.856); Cleveland Clinic score AUC: 0.670 (0.604–0.737); SRI score AUC 0.627 (0.558–0.697); the new model versus Cleveland score, p = .001; new model versus SRI score, p < .001. (B–D) Calibration curves for the new model, SRI score, and Cleveland score, respectively. Calibration plots illustrate the relationship between the predicted AKI risk according to the models and the actual occurrence of AKI in the validation data. A plot along the 45‐degree line represents a calibration of the model in which the predicted probabilities are identical to the actual outcomes. The dotted line has a close fit to the solid line, which indicated better predictive accuracy of the model. AKI, acute kidney injury; AUC, area under the receiver operating characteristic curve; SRI, Simplified Renal Index
