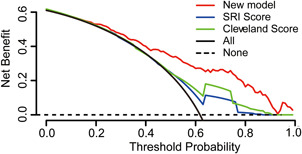
Figure 5.

Decision curve analyses for prediction models. The x‐axis shows the threshold probability. The y‐axis shows the net benefit. The dashed and solid black lines represent the hypothesis that no patients and all patients had AKI, respectively. The net benefit was computed by subtracting the proportion of false positives from the proportion of true positives in all patients, with weighting the relative harm driven by the false positive. The threshold probability was where the expected benefit of avoiding treatment is equal to the expected benefit of treatment. For each decision threshold, the net benefits of the new model, Cleveland score, and SRI score are presented. For a given threshold, the difference in net benefit between two scores was the additional number of AKI cases identified (per 1000) without increasing the number of false‐positive classifications. Across the range of decision thresholds, the new model was consistently positive and had a larger net benefit than the SRI and Cleveland scores. AKI, acute kidney injury; SRI, Simplified Renal Index
