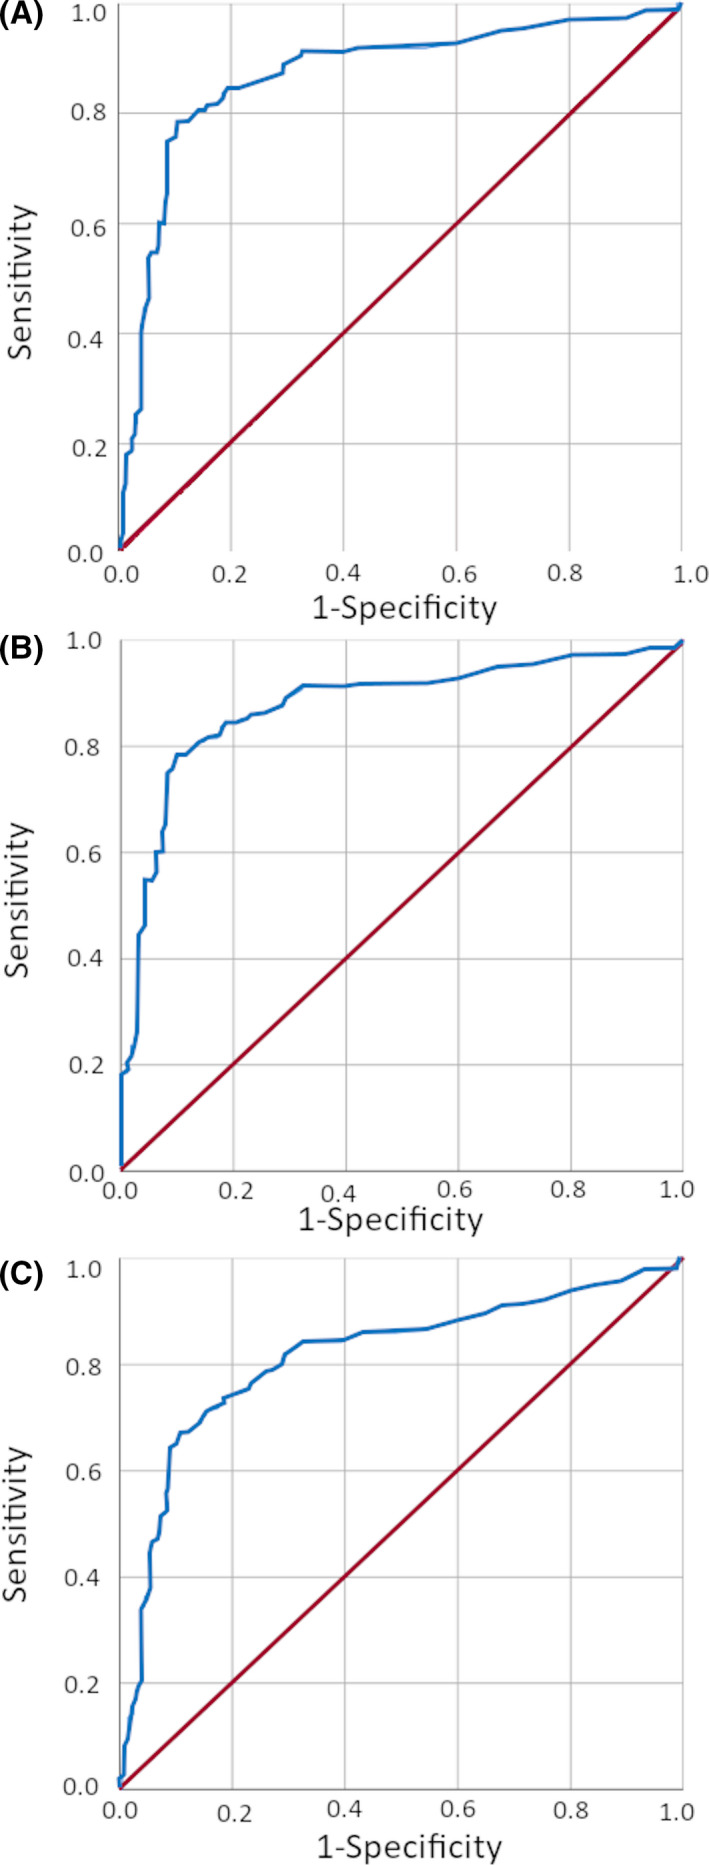
FIGURE 3.

Receiver‐operating characteristic (ROC) curve analyses. ROC curves for tonic‐clonic seizures (TCS) vs nonepileptic causes (A), TCS vs syncope (B), and TCS or other seizures vs nonepileptic causes (C)

Receiver‐operating characteristic (ROC) curve analyses. ROC curves for tonic‐clonic seizures (TCS) vs nonepileptic causes (A), TCS vs syncope (B), and TCS or other seizures vs nonepileptic causes (C)