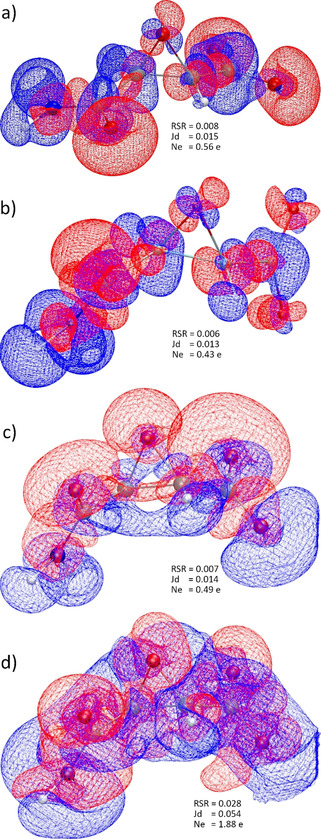
Figure 4.

Isosurfaces of interaction densities at ±0.0067 e Å−3. Red regions correspond to higher ED compared to the in vacuo state, blue to lower ED. a) Protein env.: P minus G at geom. P; b) crystal env.: C minus G at geom. C; c) cluster charges: CC minus G at exp. geom.; d) X‐ray constrained wavefunction: X minus G at exp. geom. RSR=real‐space R‐value. Jd=Jaccard distance. Ne=integrated number of electrons in the difference grid file. All isosurface representations are generated with VMD. [36]
