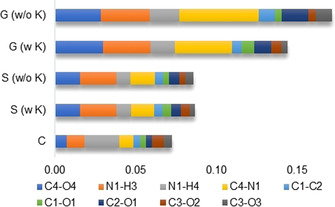
Figure 9.

Sum of the RSR values for all bond‐centered difference density grid files as visualized in Figure 8 for the four most affected bonds. The differences of the vacuum model (G) with or without K+ countercation, the solvent model (S) with or without K+ countercation and the crystal model (C) are always calculated with respect to the enzyme model (P). See also Figure S10 in the Supporting Information.
