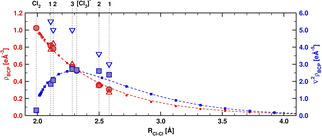
Figure 2.

Calculated and experimentally determined electron density [ρ(r BCP), red] and Laplacian [∇2 ρ(r BCP), blue] at the bond critical points (BCP) with respect to the Cl–Cl distance, R Cl–Cl. The red and blue line and small symbols show values for isolated [Cl3]− with different bond distances (see SI for further details). Large red circles show calculated values for ρ(r BCP), large blue squares show calculated values for ∇2 ρ(r BCP), and triangles correspond to measured values for systems 1–3. The vertical lines mark the bond lengths present in isolated Cl2, [Cl3]−, and the systems 1–3. A relatively small ρ(r BCP) and a positive Laplacian ∇2 ρ(r BCP) point to a serious electron density depletion at the BCP.
