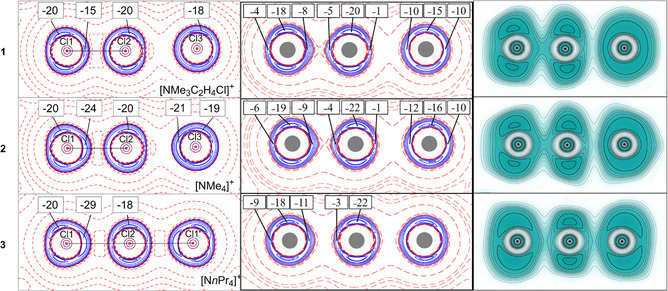
Figure 3.

Experimental (left) and calculated (middle) Laplacian of the electron density and calculated ELF (right) for 1–3. For the Laplacian, positive values are in red, negative values in blue, and contours are ±{0.001 0.002 0.004 0.008 0.02 0.04 0.08 0.2 0.4 0.8 2.0 4.0 8.0 14.0 16.0} e Å−5. The values of minima in the Laplacian are indicated. For ELF, values range from 0.0 (white) to 1.0 (dark cyan) with contours plotted from 0.1 to 1.0 in intervals of 0.1. The graphics at the left were created with XDGRAPH, [25] the graphics in the middle and at the right were created with Gri. [26]
