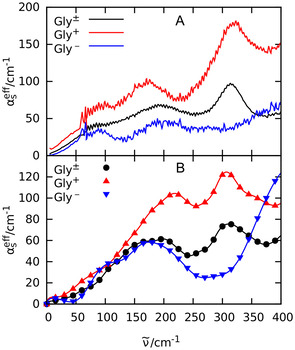
Figure 2.

(A) Experimental effective absorption spectrum of 1 m aqueous solution of glycine (black) and the reconstructed absorption spectra of (red) and (blue); see text. (B) Computed effective absorption spectrum of zwitterionic glycine Gly± (black circles), Gly+ + Cl− (red triangles pointing up), and Gly−+ Na+ (blue triangles pointing down); see Simulation Details for methodology and setup.
