Figure 3.

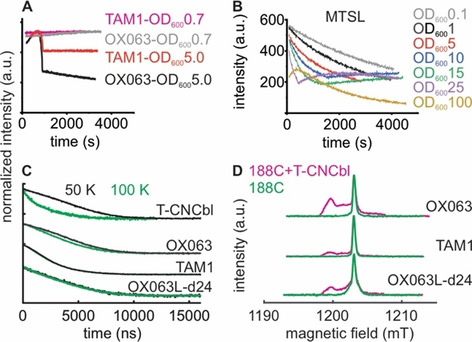
CW and pulsed ESR analysis of MTSL and trityl labels in E. coli. a) Stability curves for TAM1 and OX063 labels in E. coli suspension at OD600=5 or 0.7 as indicated. The signals are normalized for the maximum intensity. Due to a higher tendency for aggregation, the TAM1 concentration was always lower than the OX063 labels (see Figure S1, Supporting Information). The active resonator volume is ≈32 μL, which contains ≈2.5×10⁶ or ≈2.5×10⁹ cells at an OD600 of 0.1 or 100, respectively. b) Redox kinetics for MTSL in E. coli at different OD600 values as indicated. c) Transverse relaxation measurements (intensity normalized) for different trityls and T‐CNCbl bound to BtuB (as indicated) in E. coli at 50 or 100 K. d) Echo‐detected field‐swept spectra for the trityl labels attached to BtuB in E. coli at 100 K.
