
Figure 1. Comparison between GLUT1 and GLUT3.
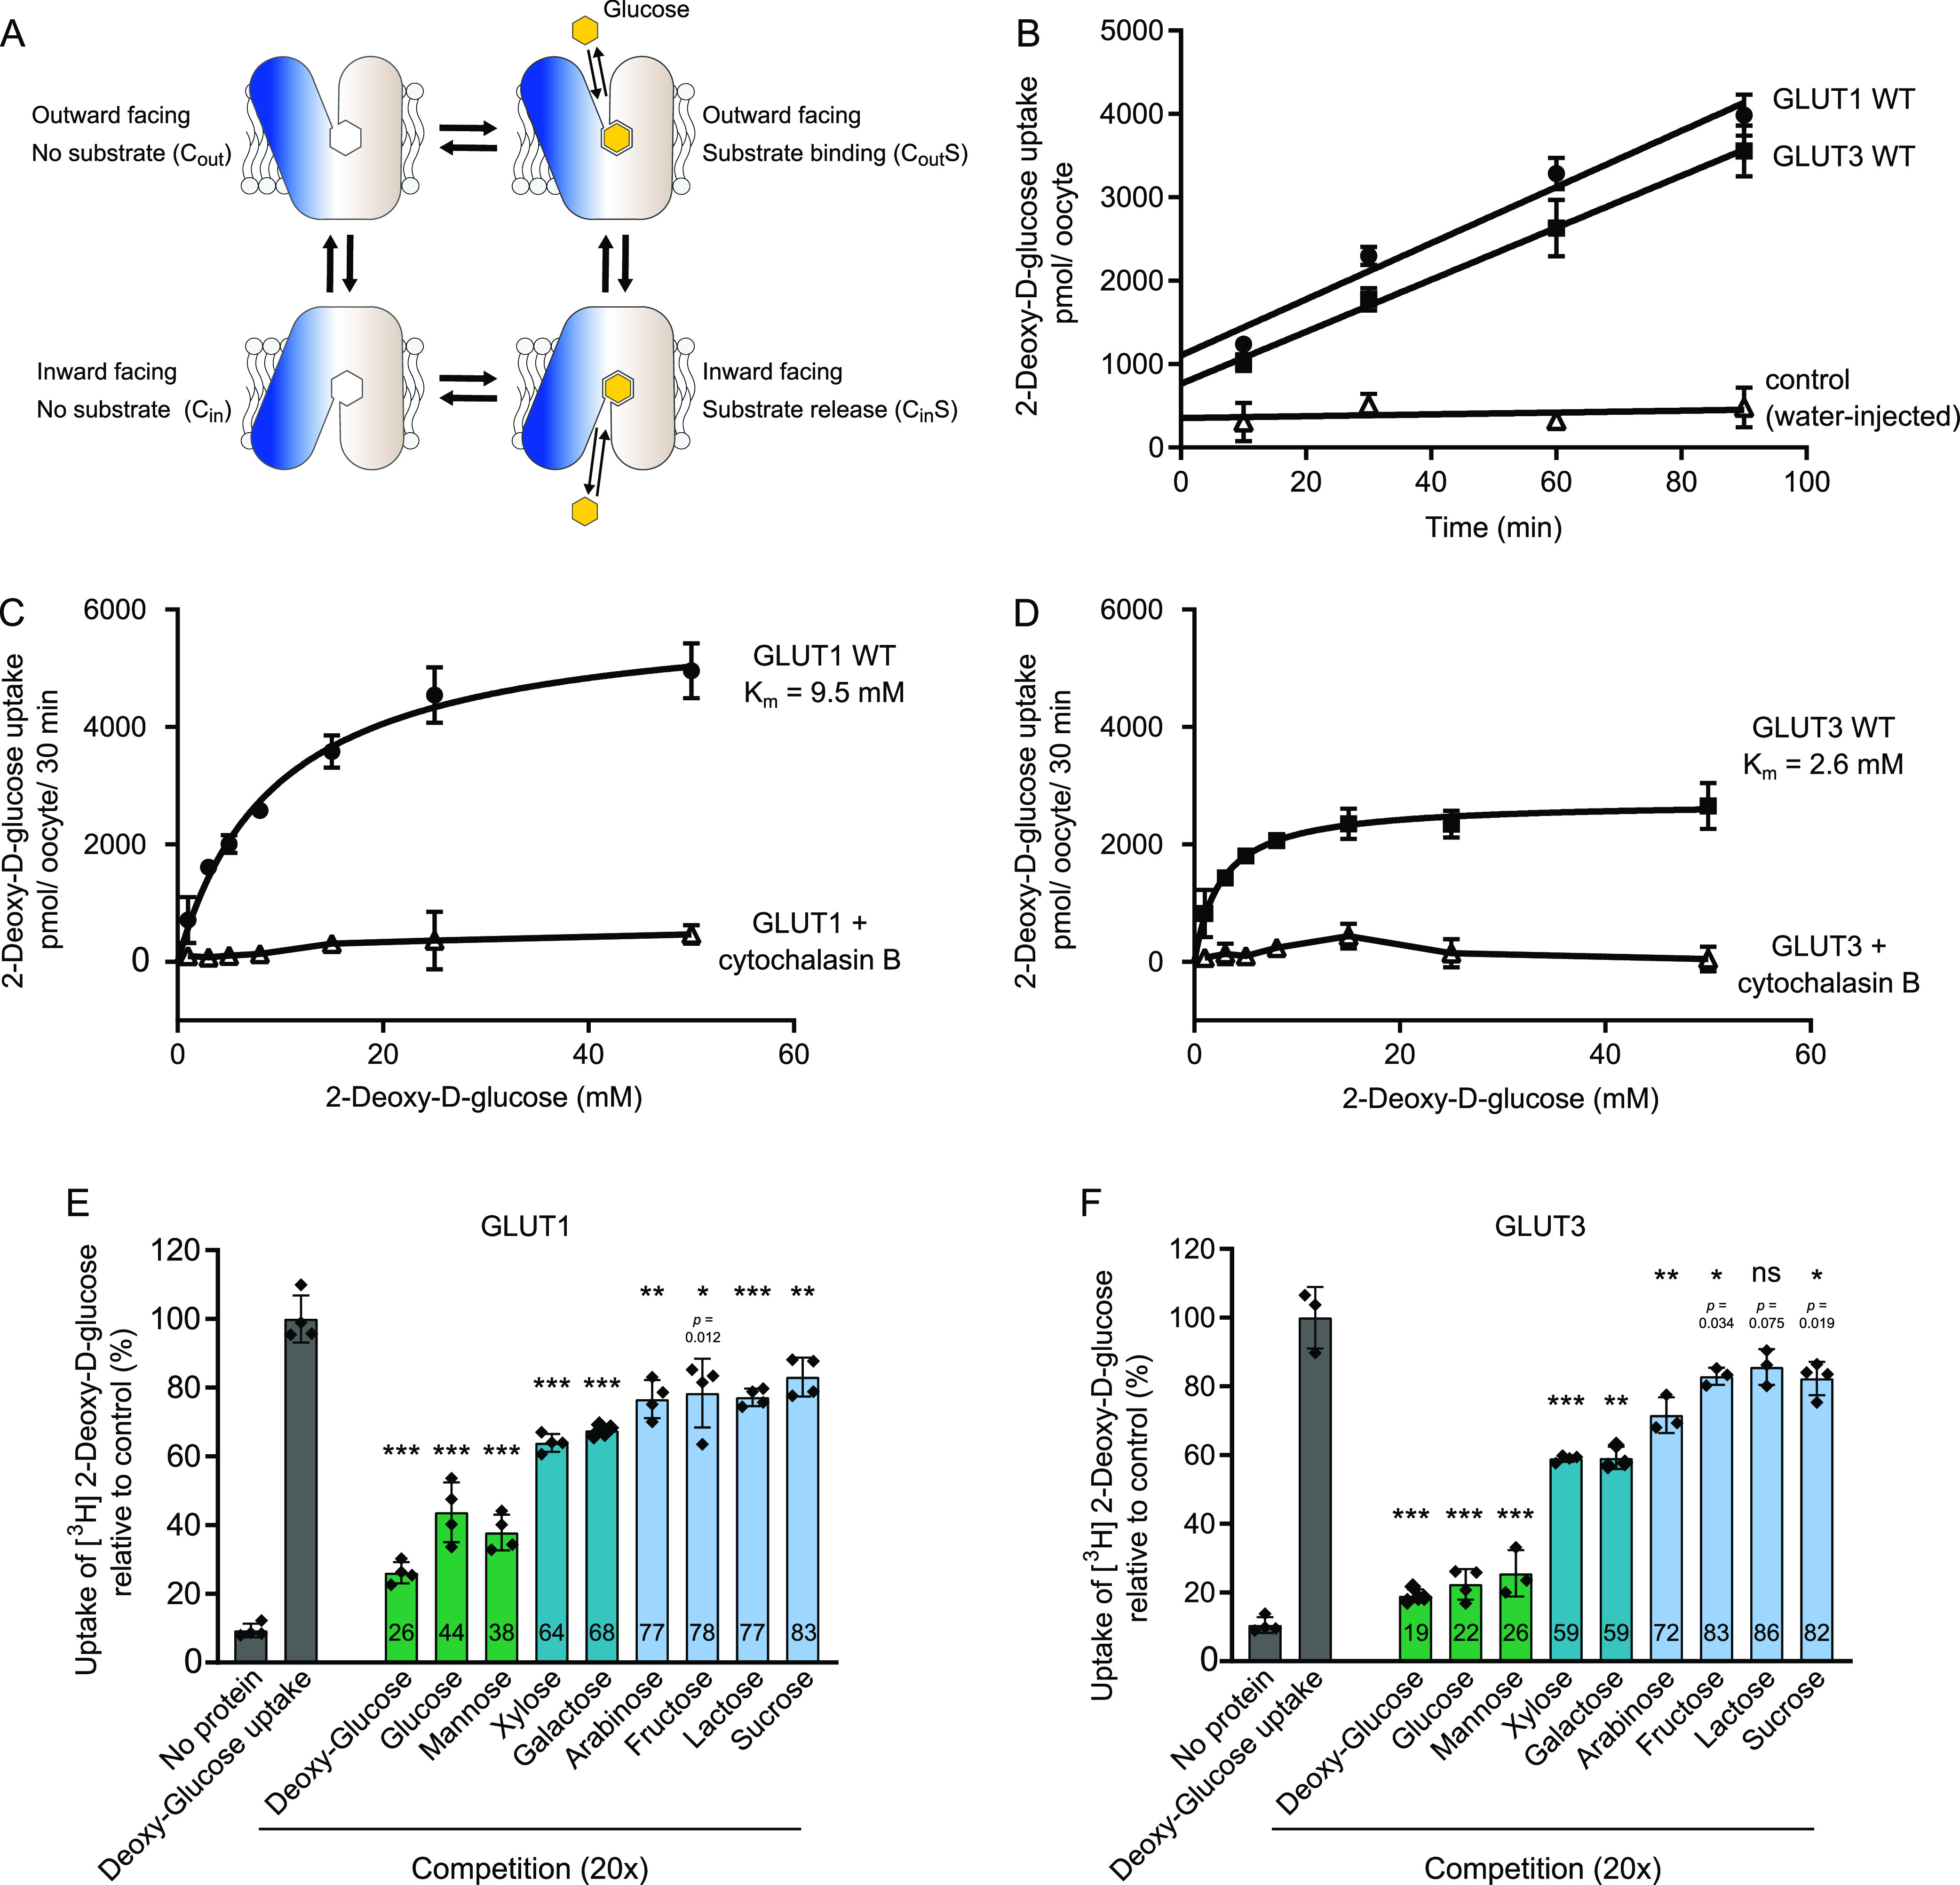
(A) Schematic model for transport by GLUTs, alternating between two major conformations with the substrate-binding site exposed to the inside and outside of the cell. Transition between these conformations leads to sugar transport across the membrane following the substrate concentration gradient. (B) Uptake of 2-DG into GLUT1-injected Xenopus oocytes (circle), GLUT3-injected oocytes (squares) or water-injected oocytes (open triangles) at an initial outside concentration of 5 mM 2-DG. For both proteins, 2-DG uptake was linear in the range of 90 min. Data for all assays are mean ± SD of three or more replicate experiments. (C) Determination of the kinetic parameters for the transport of 2-DG of GLUT1. The data were fitted using the Michaelis–Menten non-linear fit, yielding a Km = 9.5 ± 1.0 mM and Vmax = 5,988 ± 226 pmol/oocyte/30 min. Sugar uptake was inhibited in GLUT1-injected oocytes exposed to cytochalasin B. (D) Determination of the kinetic parameters for the transport of 2-DG of GLUT3. The data were fitted using the Michaelis–Menten non-linear fit, yielding a Km = 2.6 ± 0.4 mM and Vmax = 2,731 ± 94 pmol/oocyte/30 min. Sugar uptake was inhibited in GLUT3-injected oocytes exposed to cytochalasin B. (E) Substrate selectivity of GLUT1 determined by competition assay in oocytes exposed to 5 mM 2-DG and 20× fold of the competing sugar, for 15 min. (F) Substrate selectivity of GLUT3 determined by competition assay in oocytes exposed to 5 mM 2-DG and 20× fold of the competing sugar, for 15 min. Data information: In (B, C, D, E, F) Data for all assays are mean ± SD of three or more replicate experiments. In (E, F) ns, Not significant; *P ≤ 0.05; **P ≤ 0.01; and ***P ≤ 0.001 by t test. P-value is shown for ns and *.