
Figure 2. Crystal structure of GLUT1 reveals new ligands.
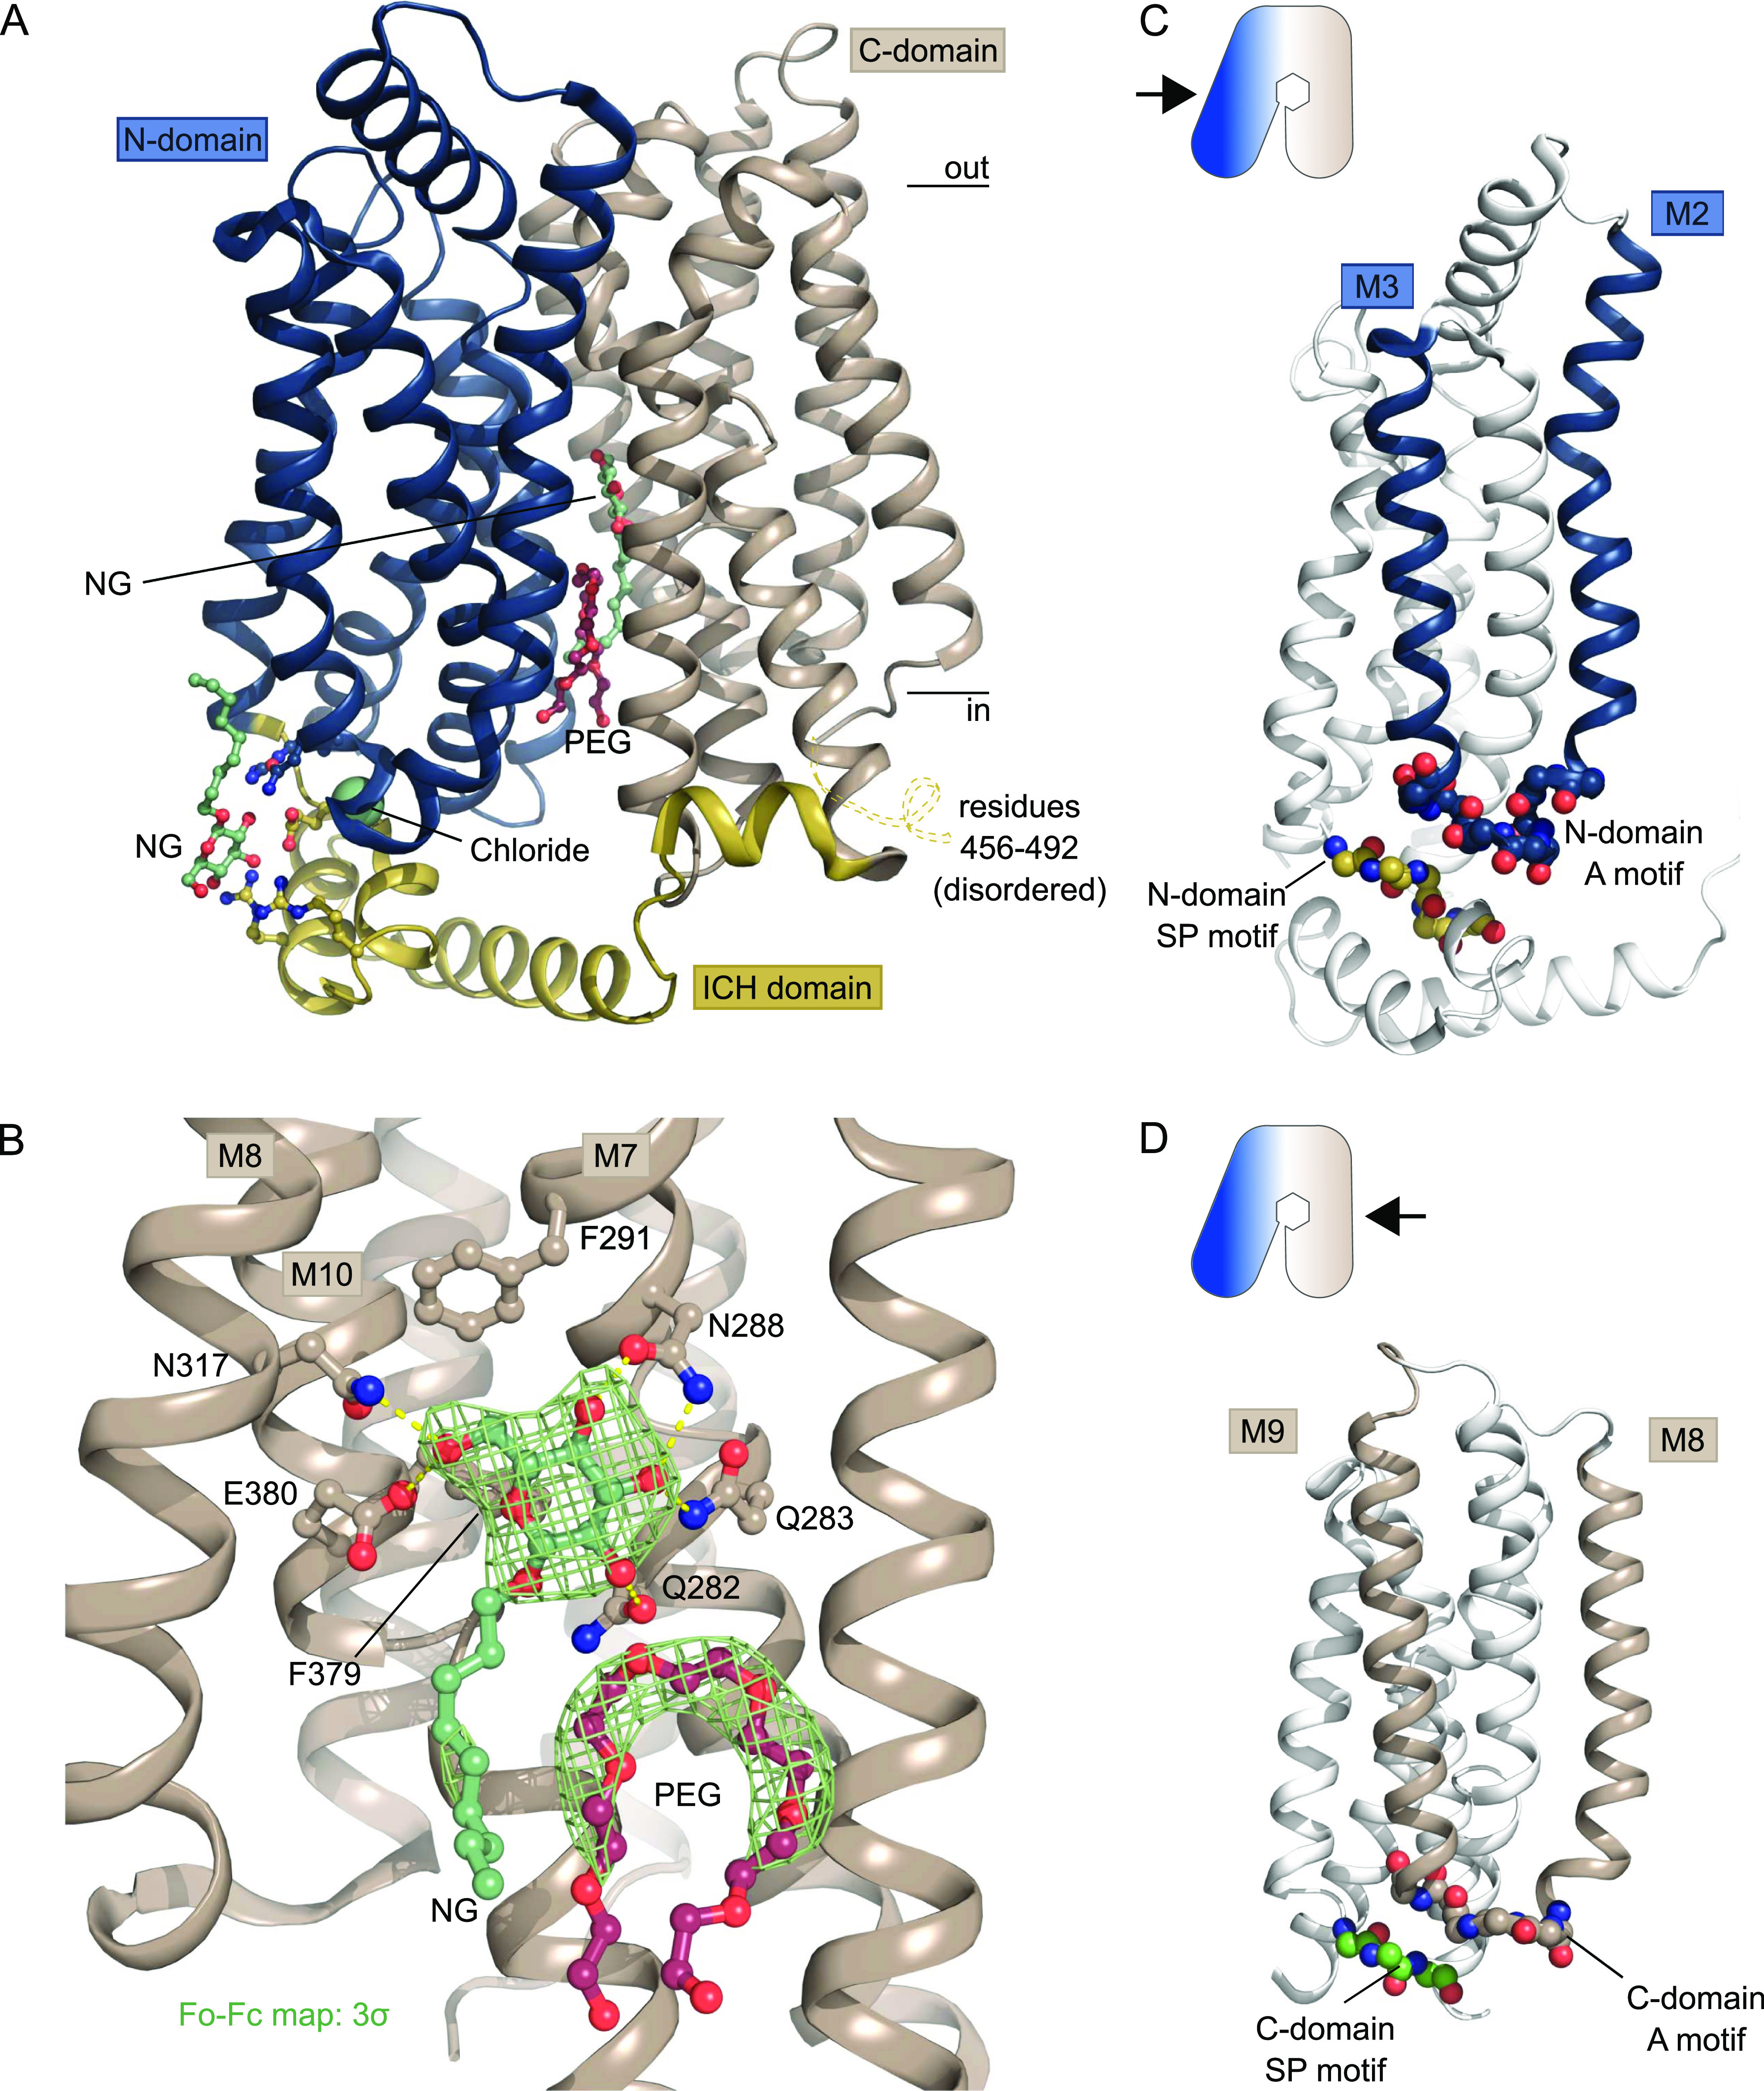
(A) The overall structure of GLUT1 in the inward-open conformation. The structure represents a bound state with an NG molecule (shown as sticks) in the central cavity formed between the N-domain (blue) and the C-domain (brown), followed by a PEG molecule (shown as sticks). In close proximity with the ICH domain (yellow) another NG molecule (shown as sticks) was found, as well as a chloride ion (shown as a sphere). Selected residues are shown as sticks. Black lines depict the approximate location of the membrane. (B) Coordination of the glucose moiety in the central cavity by residues from C-domain. Hydrogen bonds are represented by yellow dashes (2.6–3.6 Å distances). The omit Fo-Fc density for NG and PEG is contoured in green at 3 σ. (C) Side view of GLUT1 shows the localization of the N-domain Sugar Porter motif directly underneath the A-motif from the M2-M3 loop. Signature motifs are shown as spheres. (D) Side view of GLUT1 shows the localization of the C-domain Sugar Porter motif directly underneath the A-motif from the M8-M9 loop. Signature motifs are shown as spheres.