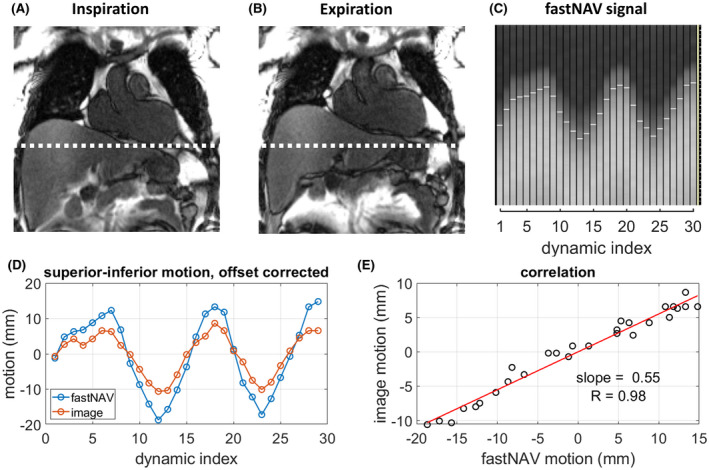
FIGURE 2.

Calibration of the tracking factor with fastNAV. (A&B) Examples of coronal calibration images in inspiration ([A] dynamic index 13) and expiration ([B] dynamic index 18) that are used to detect LV motion. A dotted white line marks the inferior edge of the LV in inspiration to highlight the difference with expiration. After a region of interest (not shown) was manually drawn around the LV in 1 of the images, image registration was used to determine the motion of the LV across the time series. (C) Example of fastNAV signal for which white horizontal line segments mark the detected positions, which wereexported for tracking factor calibration. (D) Superoinferior fastNAV‐based RHD motion and imaged‐based LV motion after subtraction of their mean values. (E) Correlation between the fastNAV‐based and image‐based motion traces. The slope was found using least‐squares fitting and was used as subject‐specific tracking factor. Data shown is subject 3. RHD, right hemidiaphragm
