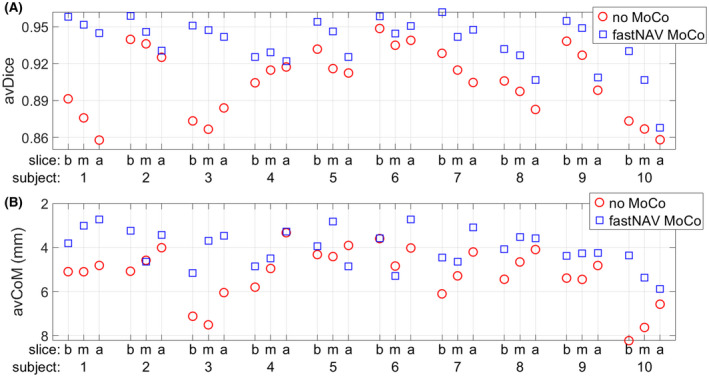
FIGURE 5.

Quantitative motion analysis of perfusion images over all subjects using the conventional sequence (no MoCo, red circles) and the fastNAV prospective motion‐corrected sequence (fastNAV MoCo, blue squares). (A) Average overlap of the LV across images (avDice). (B) Average displacement of the LV center of mass (avCoM), with inverted y‐axis direction to aid the comparison with avDice (ie, a high position in the graph indicates little motion). All results are shown per subject and per slice (b/m/a). The proposed fastNAV led to higher avDice (0.94 ± 0.02 vs. 0.91 ± 0.03, P < .001) and reduced avCoM (4.03 ± 0.84 vs. 5.22 ± 1.22, P < .001) when compared to the conventional approach. a, apex; b, base; m, mid; MoCo; motion correction
