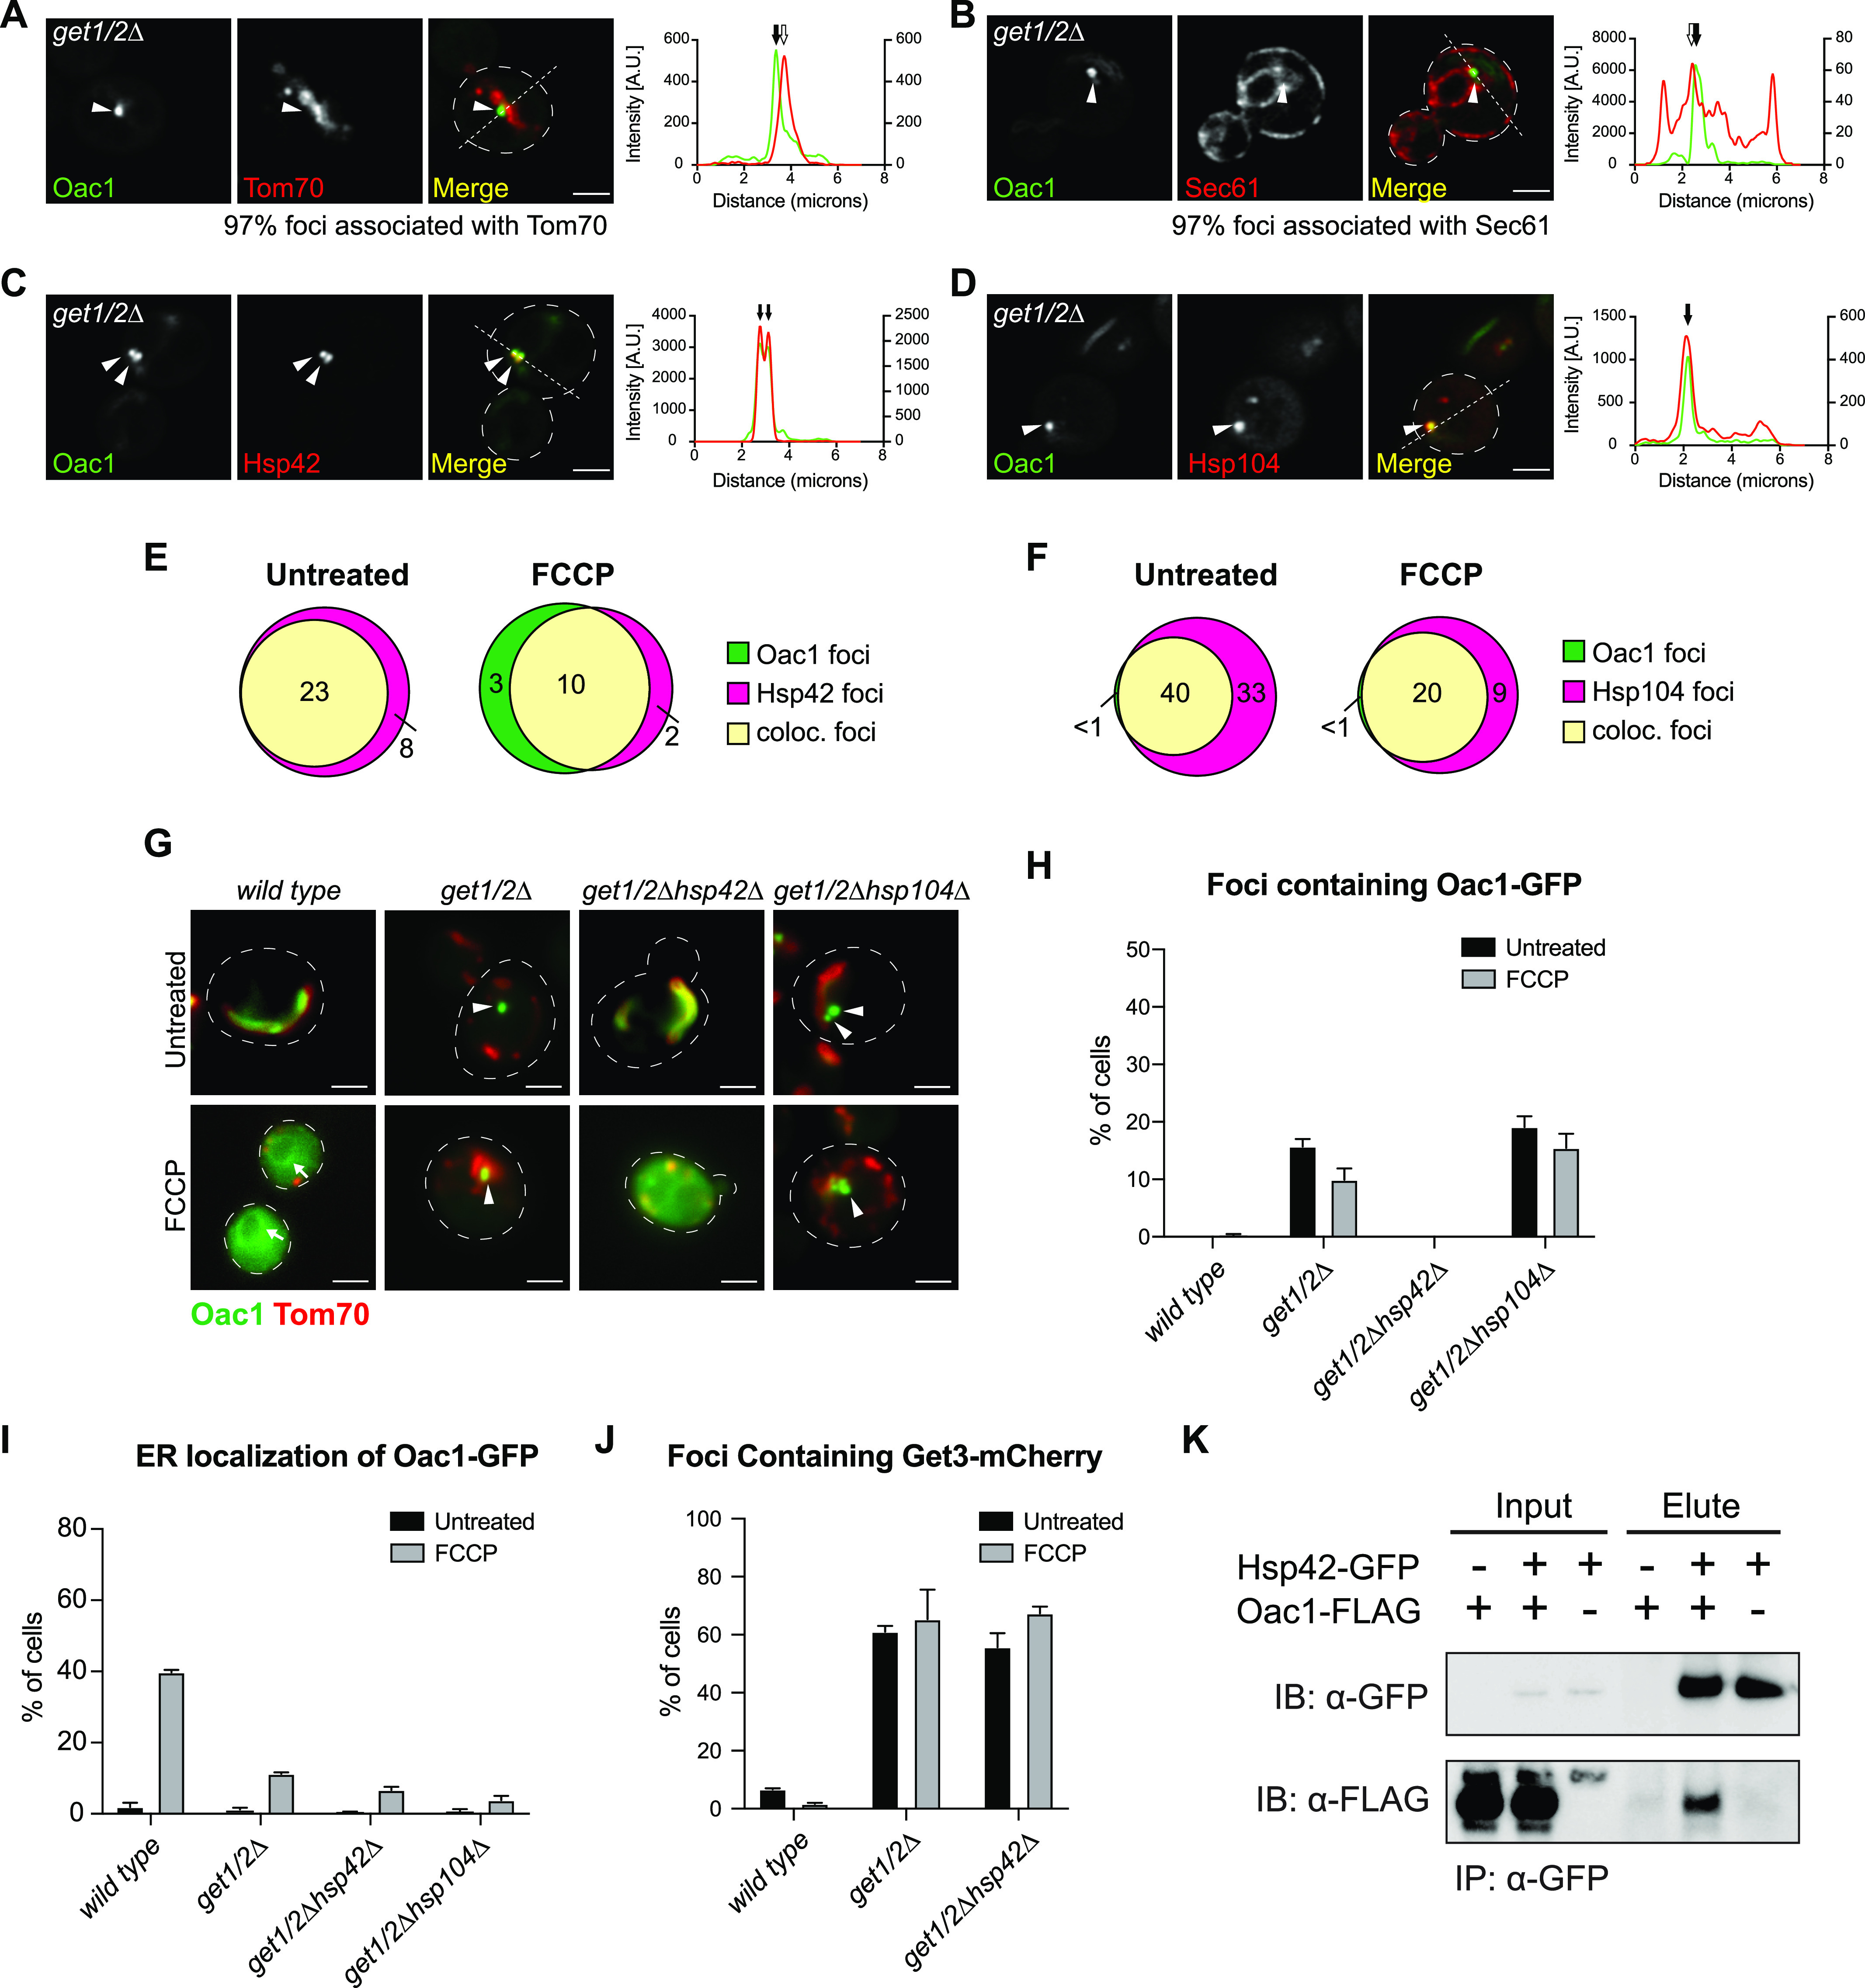
Figure 3. Oac1-GFP localizes to mitochondrion- and ER-associated Hsp42-dependent foci in the absence of a functional GET pathway.

(A, B, C, D) Super-resolution images and line scan analysis of get1/2Δ mutant yeast expressing Oac1-GFP and Tom70-mCherry (A), Sec61-mCherry (B), Hsp42-mCherry (C), or Hsp104-mCherry (D). White arrowhead marks protein foci containing Oac1-GFP. For microscopy images, white line marks fluorescence intensity profile position. Images show single focal plane. Scale bar = 2 μm. For line scan graphs, Left and right y-axis correspond to GFP and mCherry fluorescence intensity, respectively. Black arrow marks protein foci position and white arrow marks mitochondria (A) or ER (B) position that is associated with protein foci. For the quantification in (A) and (B), N > 100 cells per replicate of three replicates. (E, F) Quantification of (C) and (D), respectively, showing the number of foci only containing Oac1-GFP (green), Hsp42-mCherry (E) or Hsp104-mCherry (F) (magenta) or both (yellow) per 100 cells −/+ FCCP. N > 100 cells per replicate of three replicates, values are normalized to number of foci per 100 cells. (G) Wide-field images of wild-type cells and the indicated mutant yeast expressing Oac1-GFP and Tom70-mCherry −/+ FCCP. White arrows mark perinuclear ER. White arrowheads mark protein foci containing Oac1-GFP. Images show single focal plane. Scale bar = 2 μm. (H, I) Quantification of (G) showing the percentage of cells with Oac1-GFP localized to protein foci (H) or the ER (I). N > 100 cells per replicate, error bars = SEM of three replicates. (J) Quantification of the percentage of cells with protein foci containing Get3-mCherry in wild-type or the indicated mutant cells. N > 100 cells per replicate, error bars = SEM of three replicates. (K) Western blot probing for GFP and FLAG in input or elution products of immunoprecipitated Hsp42-GFP in the indicated yeast strains.
