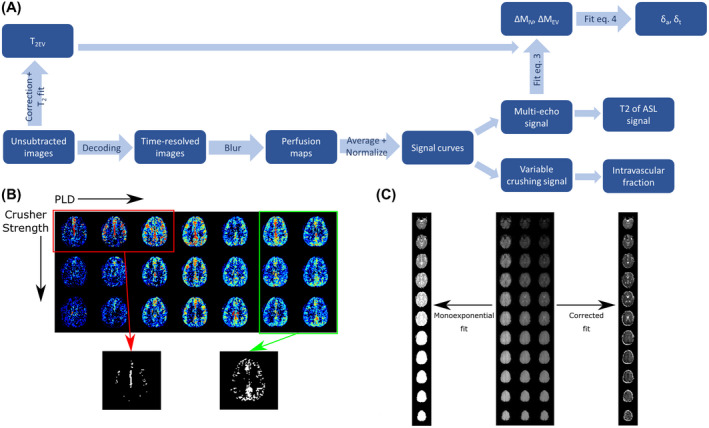
FIGURE 2.

A, Data analysis pipeline. B, The masking step. The three earliest time points of the uncrushed perfusion maps are averaged and thresholded to obtain the vascular mask. The two last time points of images from all crusher settings are averaged and thresholded for the gray‐matter mask, and any voxels from the arterial mask are removed. C, The T2EV maps without (left) and with (right) correction for the sequential slice acquisition
