FIGURE 4.

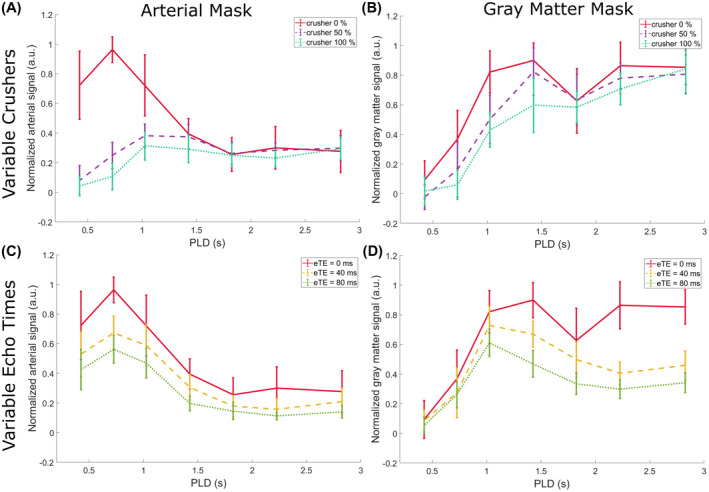
Average normalized gray matter and arterial signal through time, showing effects of crushers and TEs. Error bars indicate the SEM of the subjects

Average normalized gray matter and arterial signal through time, showing effects of crushers and TEs. Error bars indicate the SEM of the subjects