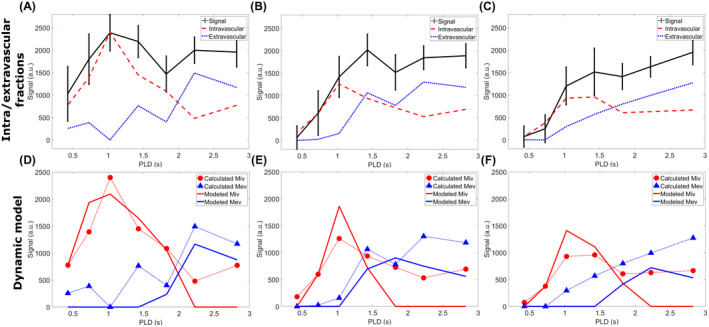
FIGURE 5.

Results of the dynamic model fitting. In the top row, the ASL signal is broken down into intravascular and extravascular components (∆MIV and ∆MEV, respectively), using T2 differences (Equation 3). On the bottom row, these same components (dotted lines with markers) are fitted to Equation 4, and the resulting dynamic fit is given by the solid lines (red for intravascular, blue for extravascular). This analysis was performed on the population average data, and repeated for all three applied gradient strengths (no gradient in left column to highest gradient strength on the right). Confidence intervals were calculated for each point in the fit but were too large to be shown here
