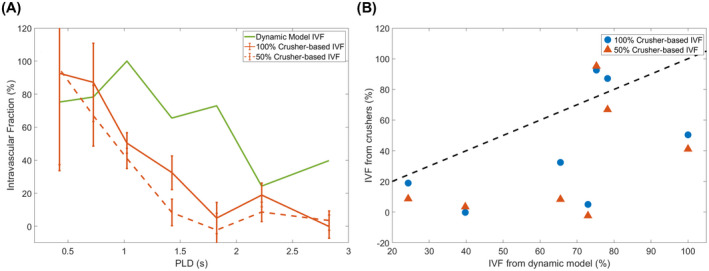
FIGURE 6.

Comparison of the intravascular fractions (IVFs) as calculated with both methods. A, The IVFs are shown through time, for the crusher‐gradient technique (orange) and the compartmental model applied to the variable eTE data (green). B, Scatterplot showing the direct comparison of IVF values from both techniques (the black dotted line represents a perfect match)
