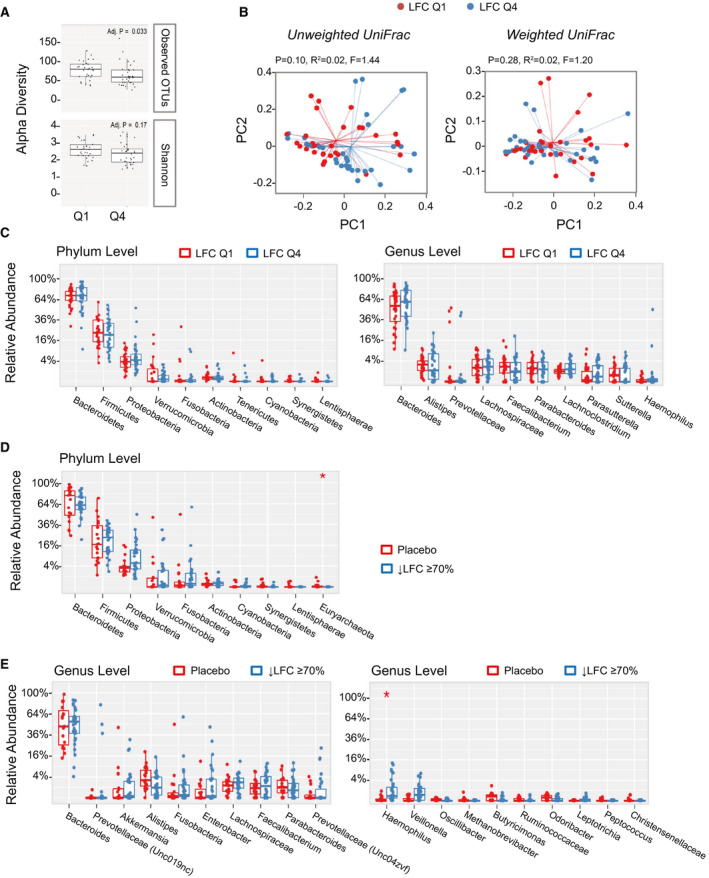
Fig. 6.

Correlation between gut microbiome and LFC measured by MRI‐PDFF. (A) Patients were grouped into the top quartile (Q4) versus the bottom quartile (Q1) according to baseline LFC. Differences in alpha diversity were observed between Q1 and Q4 subjects using the observed OTUs but not the Shannon index. (B) Weighted UniFrac analysis showed no separation between low liver fat (Q1) and high liver fat (Q4) populations at baseline, whereas unweighted UniFrac showed a trend of clustering. (C) No significant difference at the phylum and genus level between low liver fat (Q1) and high liver fat (Q4) populations. (D) Relative abundance of top phyla in subjects with ≥ 70% reduction in LFC (i.e., super‐responders). At the phylum level, Euryarchaeota significantly differed between aldafermin‐treated subjects who had ≥ 70% reduction in LFC and the placebo group (*P < 0.05 by Mann‐Whitney U test with Benjamini‐Hochberg FDR‐adjusted multiple test correction). (E) Relative abundance of top genera in subjects with ≥ 70% reduction in LFC (i.e., super‐responders). Genera are displayed with ranks ordered from left to right by their decreasing abundance (left panel) or significance (right panel). Only the top 10 phylotypes are shown for clarity. At the genus level, although the top 10 genera are similar between groups, the minor genus Haemophilus is more abundant in subjects with ≥ 70% reduction in LFC than placebo‐treated subjects (*P < 0.05 by Mann‐Whitney U test with Benjamini‐Hochberg FDR‐adjusted multiple test correction). The boxes represent the IQR, from the first and third quartiles, and the inside line represents the median. The whiskers denote the lowest and highest values within 1.5 IQR from the first and third quartiles. The circles represent outliers beyond the whiskers. All patients with paired stool samples at both day 1 and week 12 were included in the analysis: placebo (n = 18), aldafermin 0.3 mg (n = 17), 1 mg (n = 30), 3 mg (n = 36), and 6 mg (n = 21).
