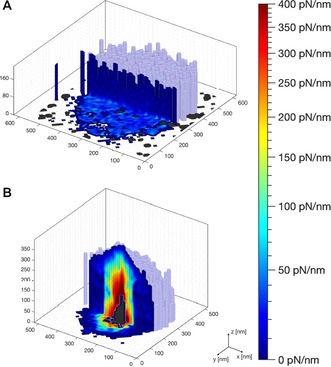
Figure 5.

Cut‐offs of the contact stiffness maps of individual ULC (A) and conventional (B) nanogels at the solid/liquid interface at T=27 °C. The x, y, and z‐axes describe the topographic information (light blue surface extracted for contact stiffness equals 0 pN nm−1), while the color code within the cut‐off planes signifies the local contact stiffness value. The dark gray color reflects the area which cannot be accessed by the AFM tip.
