Figure 1.

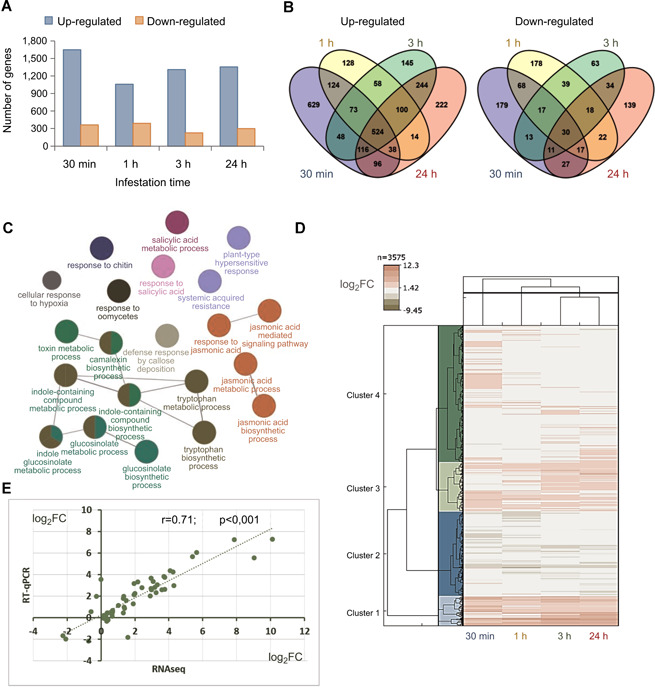
Transcriptional analysis of Arabidopsis plants infested with Tetranychus urticae during 30 min, 1, 3, and 24 h
(A) Bar diagrams showing the number of up‐ or down‐regulated genes at each infestation time point. (B) Venn diagrams showing the number of specific and shared up‐ or down‐regulated genes among infestation time points. (C) Network of the most enriched biological processes using all detected differentially expressed genes (DEGs) upon mite infestation. Colors correspond to groups of connected related terms. (D) Heatmap showing hierarchical clustering analysis of the log2FC values exhibited by the 3,575 DEGs found in mite‐infested plants compared to control plants. (E) Dispersion graphic showing the correlation between the log2FC values from RNA‐seq and quantitative real‐time polymerase chain reaction assays for 15 selected genes. Spearman rank correlation coefficient (r) is showed.
