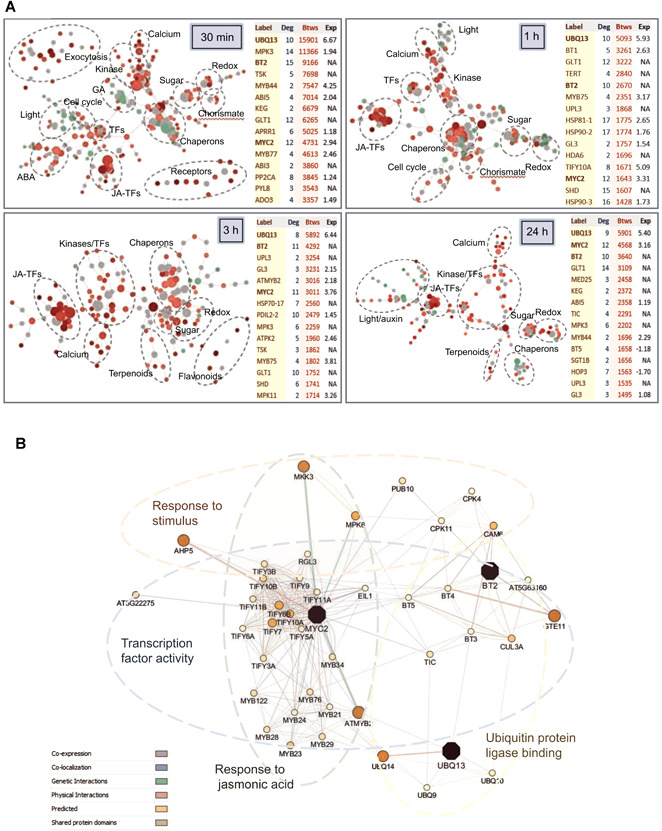
Figure 2.

Analysis of the minimum connected molecular networks
(A) Minimum connected molecular networks based on the differentially expressed genes (DEGs) in each time point and the protein‐protein interactions from STRING database. Red points, up‐regulated genes; green points, down‐regulated genes; gray points, non‐seed genes. Ellipses mark groups of genes functionally related. Tables show the 15 genes with the highest values of betweenness (Btws). The main genes detected in all infestation times are boldly typed. Deg, degree. Exp, expression fold change. NA, not altered. (B) Minimum gene network connecting the three main genes (purple). Size and colors of nodes are based on the GeneMANIA scores. Width of edges depends on the normalized maximum weight value.
