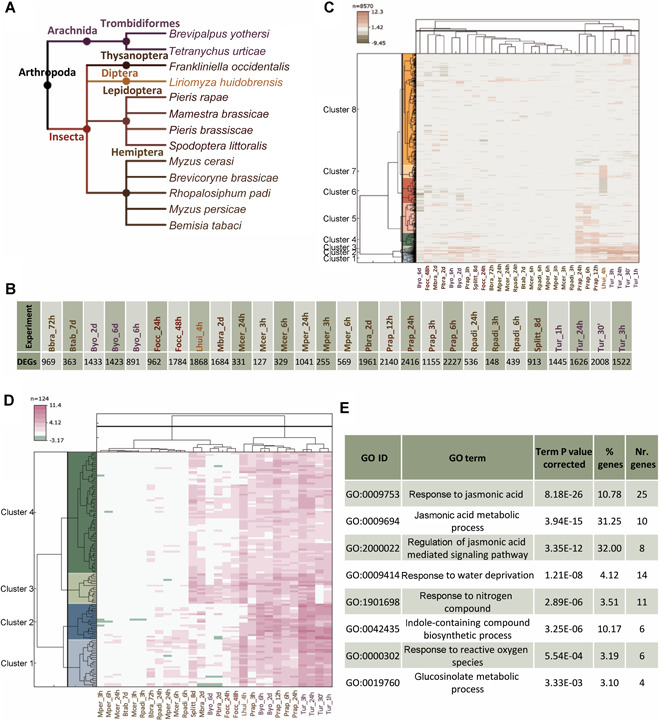
Figure 3.

Meta‐analysis of transcriptomic experiments showing the response of Arabidopsis plants to herbivore stresses
(A) Cladogram showing the taxonomic classification of the herbivore species. (B) Number of differentially expressed genes (DEGs) per experiment. (C) Heatmap showing the transcriptomic profile of all the DEGs at least detected in one experiment. (D) Heatmap showing the transcriptomic profile of the genes with a significant correlation among experiments. (E) Enriched biological processes associated with the correlated genes.
