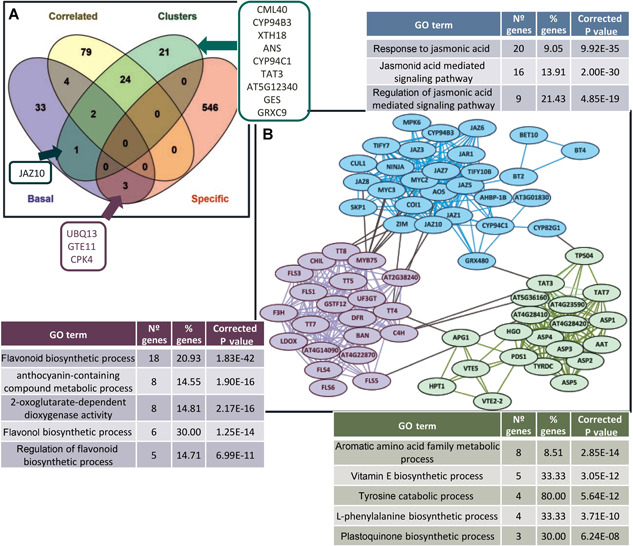
Figure 6.

Prediction of the Arabidopsis enhanced responses to Tetranychus urticae infestation
(A) Venn diagram comparing the genes involved in the basal network constructed by spider mite RNA‐seq data, the genes in which expression was correlated among herbivore experiments, the genes with a significant contribution to the cluster with the T. urticae experiments, and the genes specifically deregulated upon spider mite infestation. (B) STRING‐based network after eight rounds of adding nodes to an initial set composed of the three specific genes that appeared in the basal network, the gene shared by the basal and cluster gene sets, and the nine genes not correlated that were significantly different only in the cluster with the T. urticae experiments. Enriched biological processes for the three putative subgroups of the network are included.
