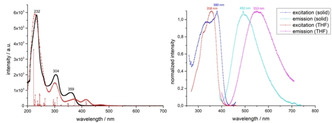
Figure 5.

Left: experimental (black) and calculated (red) absorption spectrum of 6 (TD‐DFT B3LYP DEF2‐TZVP, CPCM(THF)). Right: excitation and emission spectra of 6 in solid state (excitation at 380 nm) and in solution (excitation at 358 nm; tetrahydrofuran, c=5×10⁻⁵ M).
