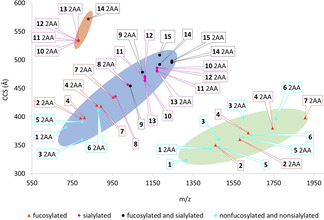
Figure 2.

Conformational space plot of free and labeled (2‐AA) N‐glycan standards as [M−H] − (green marked area), [M−2H]2− (blue marked area) and [M−3H]3− ions (orange marked area). Several standards showed multiple conformers at identical m/z values, in particular the fucosylated and sialylated glycan standards, although in this Figure only the CCS values from the most intense signals are visualized.
