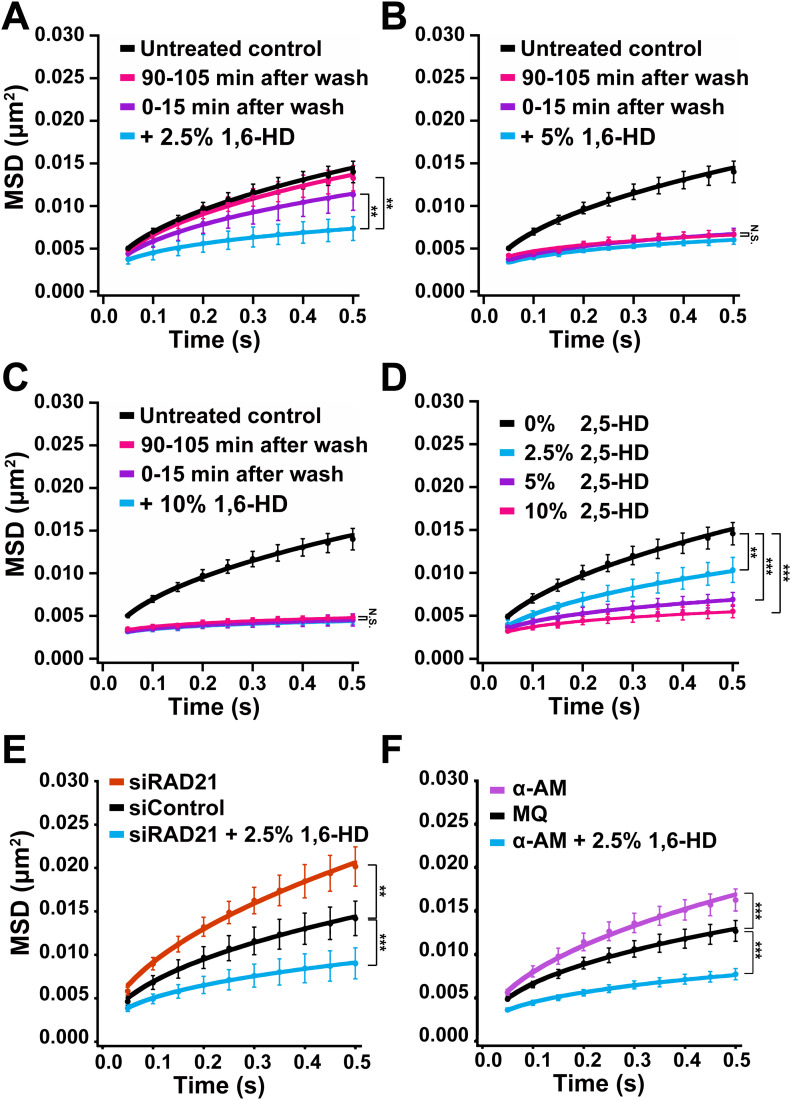
Figure 3. Effects of 1,6-HD and 2,5-HD on chromatin motion with various conditions in live cells.
(A) Mean square displacement (MSD) plots (±SD among cells) of nucleosomes in HeLa cells with indicated conditions: The cells treated with 2.5% 1,6-HD for 30 min (light blue); 0–15 min after washing out 1,6-HD (purple) and 90–105 min after washing out 1,6-HD (pink). For each condition, n = 7–8 cells. The average numbers of nucleosome trajectories used per cell, 1,000–2,000. **P < 0.01 for + 2.5% 1,6-HD versus 0–15 min after wash (P = 0.0082), and for + 2.5% 1,6-HD versus 90–105 min after wash (P = 3.1 × 10⁻⁴). (B) MSD plots (±SD among cells) of nucleosomes in HeLa cells with indicated conditions: cells treated with 5% 1,6-HD for 30 min (light blue); 0–15 min after washing out 1,6-HD (purple) and 90–105 min after washing out 1,6-HD (pink). For each condition, n = 5–7 cells. The average numbers of nucleosome trajectories used per cell, 400–900. “N.S. (statistically no significance)” for + 5% 1,6-HD versus 0–15 min after wash (P = 0.068), and for + 5% 1,6-HD versus 90–105 min after wash (P = 0.36). (C) MSD plots (±SD among cells) of nucleosomes in HeLa cells with indicated conditions: cells treated with 10% 1,6-HD for 30 min (light blue); 0–15 min after washing out 1,6-HD (purple) and 90–105 min after washing out 1,6-HD (pink). For each condition, n = 7–10 cells. The average numbers of nucleosome trajectories used per cell, 800–1,000. “N.S.” for + 10% 1,6-HD versus 0–15 min after wash (P = 0.63), and for + 10% 1,6-HD versus 90–105 min after wash (P = 0.25). (D) Decreased chromatin motion by 2,5-HD. MSD plots (±SD among cells) of nucleosomes in HeLa cells treated with 2.5% (light blue), 5% (purple), and 10% (pink) 2,5-HD for 5–30 min. For each condition, n = 8–10 cells. The average numbers of nucleosome trajectories used per cell, 600–1,900. **P < 0.01 for untreated control versus 2.5% (P = 2.2 × 10⁻⁴). ***P < 0.0001 for untreated control versus 5% (P = 4.6 × 10⁻⁵), and for untreated control versus 10% (P = 1.1 × 10⁻⁵). (E) MSD plots (±SD among cells) of nucleosomes in HeLa RAD21-KD cells untreated (orange) or treated with 2.5% 1,6-HD for 5–30 min (light blue). The control is control siRNA cells (black). For each condition, n = 10 cells. The average numbers of nucleosome trajectories used per cell, 500–1,700. **P < 0.01 for siControl versus siRAD21 (P = 2.2 × 10⁻⁴). ***P < 0.0001 for siControl versus siRAD21 + 2.5% 1,6-HD (P = 1.1 × 10⁻⁵). (F) MSD plots (±SD among cells) of nucleosomes in HeLa cells treated with RNAPII inhibitor, α-amanitin (α-AM, purple) or α-AM and 2.5% 1,6-HD for 5–60 min (light blue). The control is Milli-Q water (MQ, black). For each condition, n = 10 cells. The average numbers of nucleosome trajectories used per cell, 500–2,300. ***P < 0.0001 for MQ versus α-AM (P = 5.1 × 10⁻⁵), for MQ versus α-AM + 2.5% 1,6-HD (P = 6.4 × 10⁻⁷). Statistical significance in this figure was determined by the Kolmogorov–Smirnov test.

