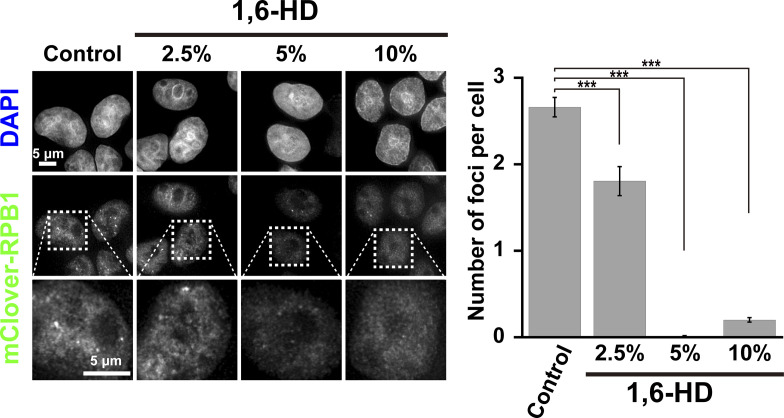
Figure S1. Transcription foci/droplets dissolved with 1,6-hexanediol (1,6-HD) treatment.
Left: Effects of 2.5%, 5%, and 10% 1,6-HD treatments for 5 min on the transcription foci/droplets fluorescently labeled by mClover-RPB1 in human DLD-1 cells. First row, DNA staining with DAPI; second-row fluorescent images of mClover-RPB1; third row, magnified images of the boxed regions in the second-row images. Right: quantification of the number of foci per cell is shown as a bar graph. Data are mean ± SEM. The mean number of foci per cell: 2.66 (n = 212 cells) in control; 1.81 (n = 72 cells) in 2.5%; 0.01 (n = 98 cells) in 5%; 0.20 (n = 268 cells) in 10% 1,6-HD. ***P < 0.0001 by the Welch’s t test for control versus 2.5% (P = 4.19 × 10⁻⁵), for control versus 5% (P = 1.07 × 10−60), and for control versus 10% (P = 3.06 × 10−56).

