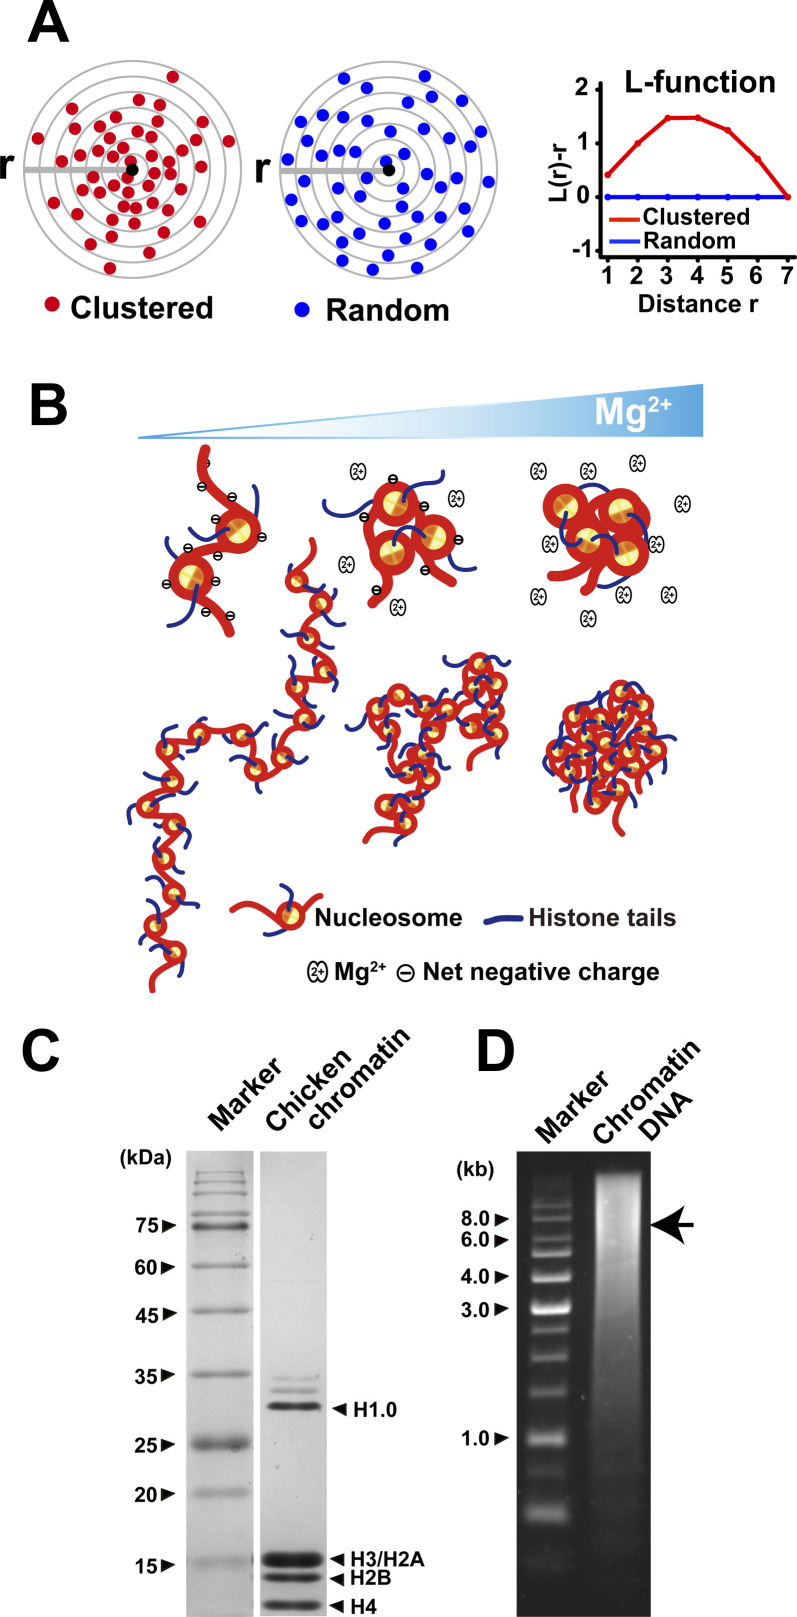
Figure S3. Scheme of L-function plot, scheme of Mg2+-dependent chromatin condensation, and verification of chicken chromatin purification.
(A) A simplified scheme for L-function analysis. Shown are clustered (red spheres, left) or random (blue spheres, right) particles around the origin point (black sphere). L-function plot of a random pattern (blue) is ∼0, but not that of clustered one (red). Panel (A) was reproduced from Nozaki et al (2017) with modifications. (B) A scheme for Mg2+-dependent chromatin condensation. In the absence of cations and other positive charged factors, the chromatin is stretched by electrostatic repulsion (left). In the presence of Mg2+, Mg2+ weakly associates with phosphate backbones of DNA in chromatin (i.e., ion atmosphere in previous report [Lipfert et al, 2014]), and then decreases net negative charge and repulsion (center). In this situation, nucleosome–nucleosome interactions via histone tails in the chromatin increase and dominate the repulsion, leading to local chromatin folding (center). More Mg2+ can take away the repulsion almost completely and promote interdigitated nucleosome–nucleosome interactions via histone tails and assembly of condensates (right). (C) SDS–PAGE of purified chicken chromatin. Nucleosome core histones H2A/H2B, H3, and H4 as well as linker histone H1.0 are present in the sample. (D) Agarose gel of isolated chromatin DNA. Average DNA length is ∼8 kb (arrow).

