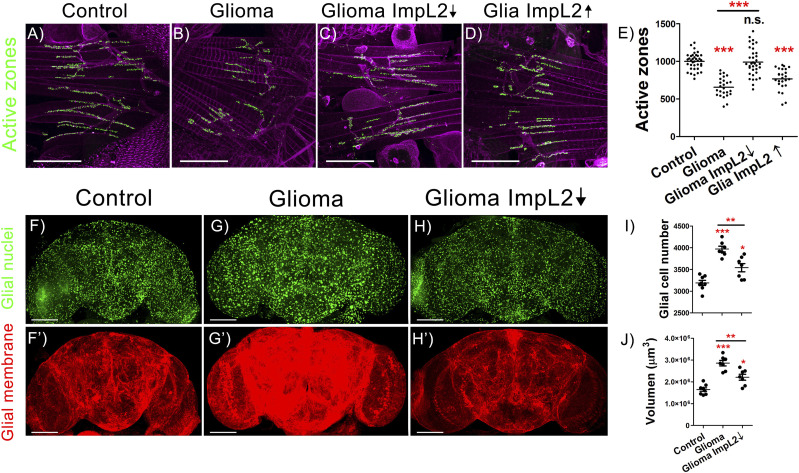
Figure 2. ImpL2 down-regulation in glioma cells rescues neurodegeneration and reduces tumor progression.
(A, B, C, D) Confocal images of adult neuromuscular junction (NMJ) at 29°C from (A) repo>UAS-LacZ (Control), (B) repo>UAS-dEGFRλ, UAS-dp110CAAX (Glioma), (C) repo>UAS-dEGFRλ, UAS-dp110CAAX, UAS-ImpL2 RNAi (Glioma ImpL2↓), and (D) repo>ImpL2 (Glia ImpL2↑) 7-d-old animals. Active zones are marked in green (anti-NC82) (scale bar, 50 μm). (E) Quantification and statistical analysis of active zones in at least N = 13 per genotype (ANOVA, post hoc Bonferroni). (F, G, H) Confocal microscopy images of adult brains from (F) repo>UAS-LacZ, (G) repo>UAS-dEGFRλ, UAS-dp110CAAX and (H) repo>UAS-dEGFRλ, UAS-dp110CAAX, UAS-ImpL2 RNAi flies after 7 d at 29°C with the glial nuclei marked in green. (F′, G′, H′) Glial membrane is shown in red (scale bar, 100 μm). (I, J) Quantification of (I) glial cell number and (J) glial membrane volume for at least N = 7 per genotype (ANOVA, post hoc Bonferroni) (*P-value < 0.05, **P-value < 0.01, ***P-value < 0.001).

