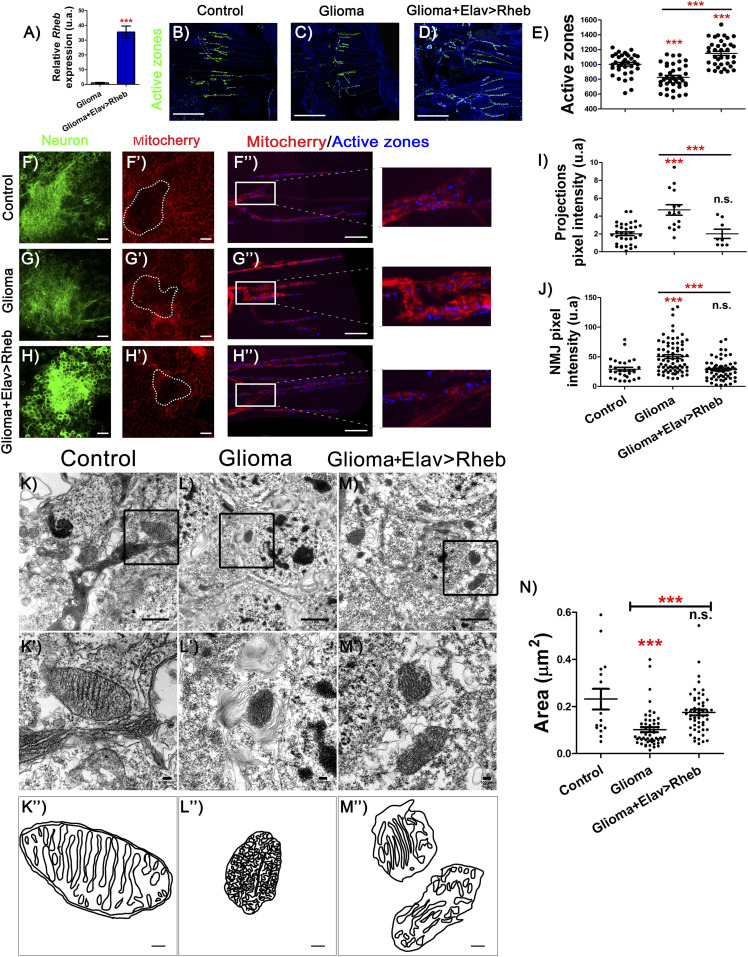
Figure 5. Rheb expression in neurons rescues active zone loss and mitochondrial alterations.
(A) qRT-PCR of 7-d-old adult brains from repo>UAS-dEGFRλ, UAS-dp110CAAX; Elav-LexA>lexAop-CD8GFP (Glioma) and repo>UAS-dEGFRλ, UAS-dp110CAAX; elav-LexA>lexAop-CD8GFP, lexAop-Rheb (Glioma+Elav>Rheb) flies show Rheb expression in glioma brains, and Rheb up-regulation by ectopic expression of Rheb in neurons (t test). (B, C, D) Adult neuromuscular junction (NMJ) from (B) repo>UAS-LacZ; elav-LexA (C) repo>UAS-dEGFRλ, UAS-dp110CAAX; elav-LexA and (D) repo>UAS-dEGFRλ, UAS-dp110CAAX; elav-LexA lexAop-Rheb after 7 d at 29°C (active zones are marked in green). (E) Quantification and statistical analysis of active zones in at least N = 20 per genotype (ANOVA, post hoc Bonferroni) (scale bar, 50 μm). (F, F′, G, G′, H, H′) Confocal microscopy images of adult brains (detail of Kenyon cells) from (F) repo>UAS-LacZ; elav-LexA (G) repo>UAS-dEGFRλ, UAS-dp110CAAX; elav-LexA and (H) repo>UAS-dEGFRλ, UAS-dp110CAAX; elav-LexA lexAop-Rheb 7 d at 29°C in all the cases combined with lexAop-mito-Cherry transgene (red), and neural membrane shown in green and (F′, G′, H′), mitochondrial membrane in red (scale bar, 10 μm). (F, F″, G, G″, H, H″) NMJ confocal images of the same genotypes as in (F, G, H) show mitochondrial marked in red and active zones in blue (scale bar, 10 μm). (I, J) Quantification and statistical analysis of pixel intensity in (I) projections and (J) NMJ in at least N = 15 and N = 6, respectively per genotype (ANOVA, post hoc Bonferroni). (K, K′, K″, L, L′, L″, M, M′, M″) Electron microscopy images of neurons from adult brains of (K) repo>UAS-LacZ; elav-LexA, (L) repo>UAS-dEGFRλ, UAS-dp110CAAX; elav-LexA and (M) repo>UAS-dEGFRλ, UAS-dp110CAAX; elav-LexA lexAop-Rheb (scale bar, 1 μm K′, L′, M′), an amplification from black square of mitochondria in detail (scale bar, 100 nm) and cristae (K″, L″, M″) a schematic representation of the mitochondrial (scale bar, 100 nm). (N) Quantification and statistical analysis of mitochondrial area (***P-value < 0.001).

