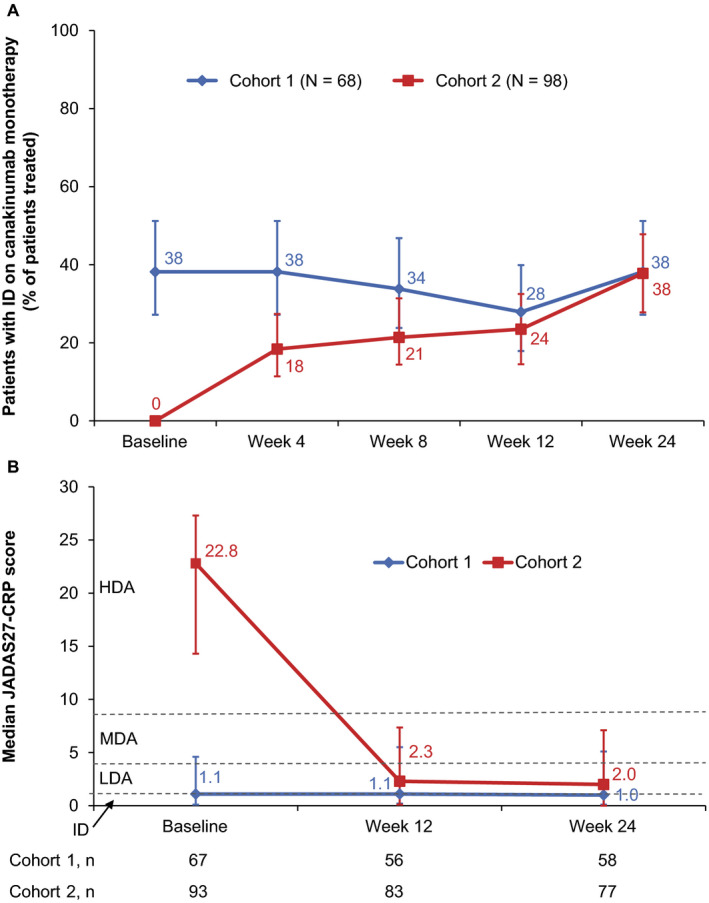
Figure 3.

Efficacy of canakinumab in part 1 of the study. A, Percentage of systemic juvenile idiopathic arthritis (JIA) patients with inactive disease (ID) following canakinumab monotherapy. Intent‐to‐treat (ITT) analysis of the full analysis set is shown, with imputation of missing data for nonresponders in the initial 24 weeks of part 1. For each time point, the percentage of patients with inactive disease who received canakinumab monotherapy (with treatment maintained until the end of part 1) is presented. Percentages were calculated from the total ITT population, which included patients who had received glucocorticoids and/or methotrexate. Values indicate percentages, and error bars show the 95% confidence intervals. Of note, no adjustment for multiple comparisons has been performed, and line graphs used are only for descriptive purposes. B, Median Juvenile Arthritis Disease Activity Scores in 27 joints using the C‐reactive protein level (JADAS27‐CRP) in cohorts 1 and 2 (n = 68 and n = 98, respectively). Numbers under the line graph represent the actual number of patients evaluated at each time point. Values indicate median scores, and error bars show the interval between the first and third quartiles. Horizontal lines represent the JADAS cutoff values for high disease activity (HDA) (>8.5), moderate disease activity (MDA) (3.9–8.5), low disease activity (LDA) (1.1–3.8), and inactive disease (≤1). Of note, these cutoff values have been defined for polyarticular JIA and have not been evaluated specifically in systemic JIA.
