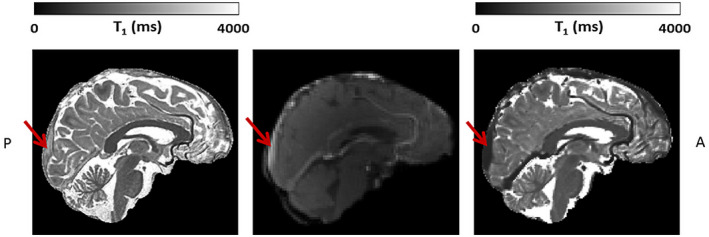
FIGURE 2.

Example slice of the high‐resolution precontrast T1 map (left), one dynamic perfusion slice obtained after contrast agent (CA) administration (middle), and the postcontrast T1 map (right) (all images skull‐stripped). The FOV of the dynamic perfusion scan captures only a small midsagittal part of the brain, containing the superior sagittal sinus (SSS), indicated with the red arrow. Note the lower T1 relaxation time values in the SSS, seen as a high signal intensity after CA administration on the dynamic perfusion scan (middle), and as a lower signal intensity on the T1 map (right)
