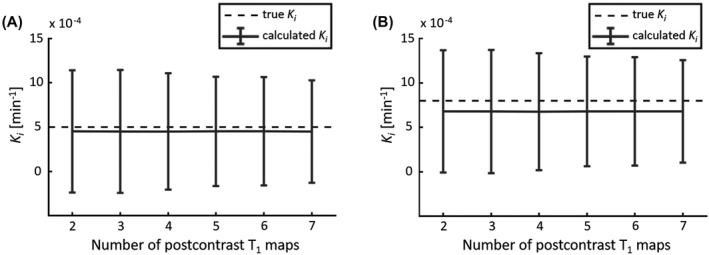
FIGURE 3.

The mean and SD (error bars) of the calculated K i obtained with simulating a varying number of postcontrast T1 maps. The dashed line represents the mean “true” K i value of white matter (WM) (A) and gray matter (GM) (B). Note the relatively large SD, which is due to the high noise level, and the slightly decreasing SD when more T1 maps are acquired
