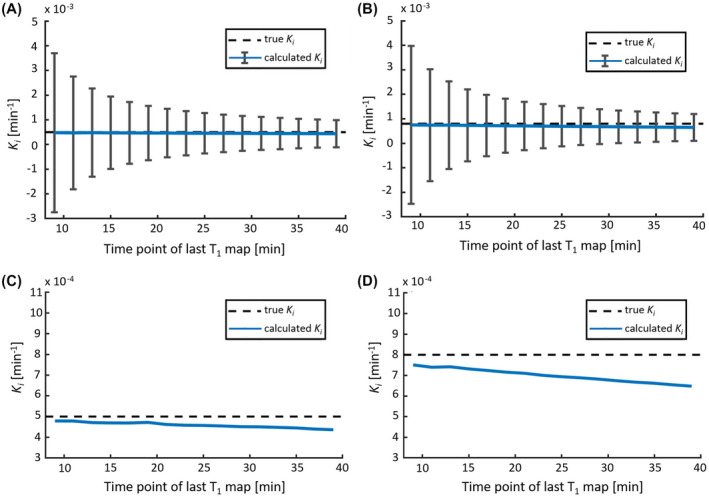
FIGURE 4.

The calculated leakage rate K i as a function of the time point of the second postcontrast T1 map (varying from 9 to 39 minutes after CA administration), which is the last T1 map in this simulation. The mean calculated K i (blue line) with the SD (error bars) for WM (A) and GM (B). Note that the SD decreases when the last T1 map is acquired at a later time point after CA administration. C,D, The mean calculated K i in comparison with the “true” K i (dashed line), as a function of the time point of the last T1 map in more detail for WM (C) and GM (D). Note that the accuracy (negative bias) of K i slightly decreases for a later T1 map, and the accuracy is lower for higher “true” K i values
