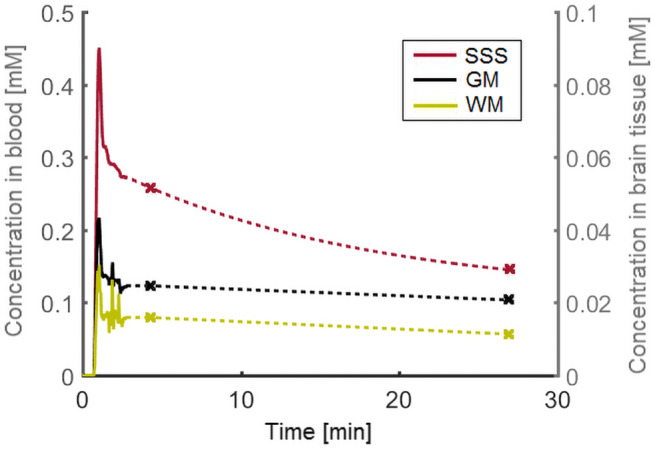
FIGURE 5.

Example of the measured concentration curves for venous blood (SSS), WM, and GM. The solid line represents the sample points obtained with the dynamic perfusion sequence. The two data points derived from the postcontrast T1 maps are indicated with a marker. Note the different concentration axes for blood (left) and tissue (right)
