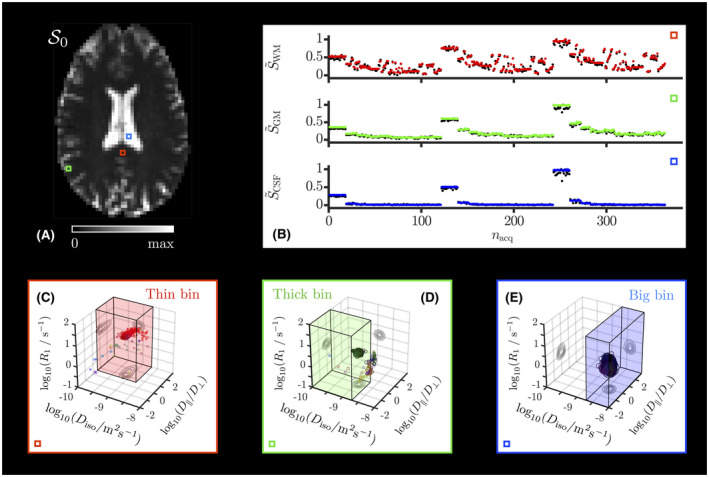
FIGURE 2.

Monte Carlo fitted signal and retrieved 5D distributions in typical voxels. A, map estimated by the Monte Carlo inversion. The colored squares delineate typical WM (red), GM (green), and CSF (blue) voxels. B, Normalized signal measured (black points) and fitted (colored points) in the archetypal voxels of panel A as a function of the sorted acquisition point index of Figure 1. (C, D, E) Nonparametric distributions estimated for the archetypal voxels of panel A and reported as scatter plots in a 3D space of the logarithms of the longitudinal relaxation rate , isotropic diffusivity , and axial‐radial diffusivity ratio . Diffusion orientations are color‐coded according to . Symbol area is proportional to the statistical weight of the corresponding component n. The contour lines on the sides of the plots represent projections of the 5D distributions onto the respective 2D planes. The “thin,” “thick,” and “big” bins defined in Section 2.2.2 are illustrated as colored boxes in the panels where they are most relevant. The colors bounding panels C, D, and E match those of the highlighted voxels in panel A
