
FIGURE 4.
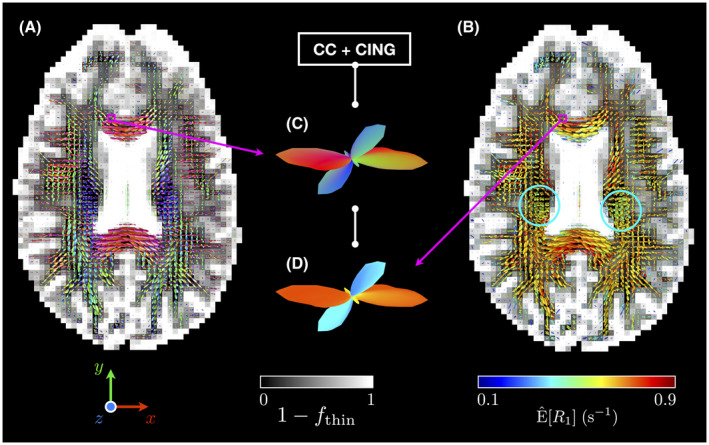
Axial gray‐scale maps of the fraction of non thin‐bin components with superimposed ODFs colored by (A) local orientation (with , and corresponding to the “left‐right,” “anterior‐posterior,” and “superior‐inferior” directions, respectively) and by (B) (see Section 2.3). The middle insets zoom on a voxel containing a fiber crossing between the corpus callosum (CC) and the cingulum (CING), and presents the estimated (C) orientation‐colored and (D) ‐colored ODFs for this voxel. While differences in seem to exist between CC and CING, such differences may also exist in the regions where the CST’s pyramidal tracts are located (blue circles), as indicated by the greener ‐colored ODFs therein