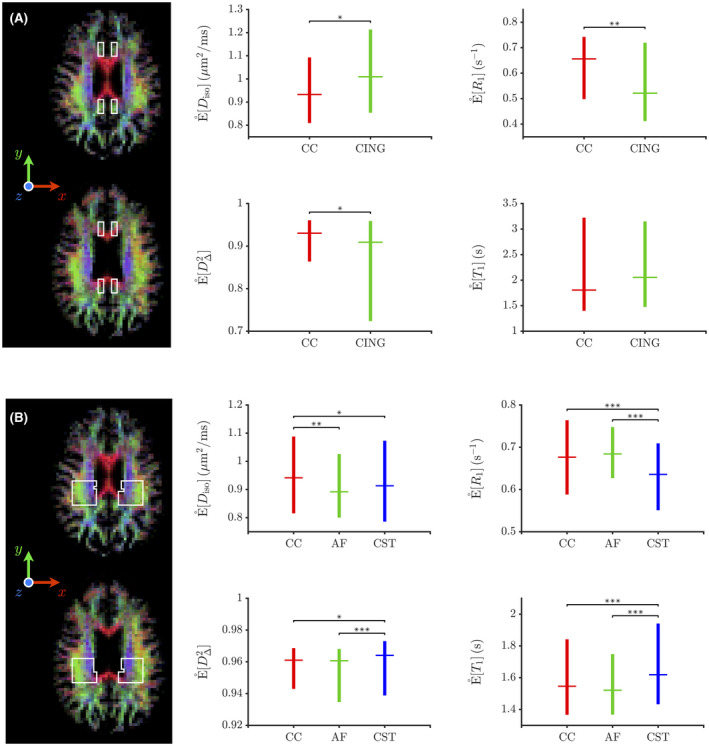
FIGURE 5.

Boxplots of the medians of the orientation‐resolved means obtained from MC‐DPC (see Section 2.3) within hand‐drawn regions of interest (ROIs), represented as white‐lined boxes over axial slices of the orientation‐colored average fraction of thin‐bin components . For a given boxplot, the horizontal line and whiskers indicate the median and the range between the first and third quartiles of the medians of the orientation‐resolved means , respectively. While panel A’s ROIs focus on crossing areas between the corpus callosum (CC) and the cingulum (CING), those of panel B focus on crossing areas between the corpus callosum (CC), the arcuate fasciculus (AF) and the corticospinal tract (CST) in the posterior corona radiata. Each MC‐DPC cluster (and associated orientation‐resolved means) is robustly assigned to one of these bundles depending on whether its median orientation is closer to the “left‐right” direction (CC), to the “anterior‐posterior” direction (CING or AF), or to the “superior‐inferior” direction (CST). The asterisks report the results of nonparametric Mann‐Whitney ‐tests assessing whether or not two orientation‐resolved means assigned to distinct bundles are sampled from identically shaped non‐median‐shifted continuous distributions (null hypothesis ). The ‐values resulting from these tests inform on the acceptance or rejection of at a certain significance level: (*), (**) and (***)
