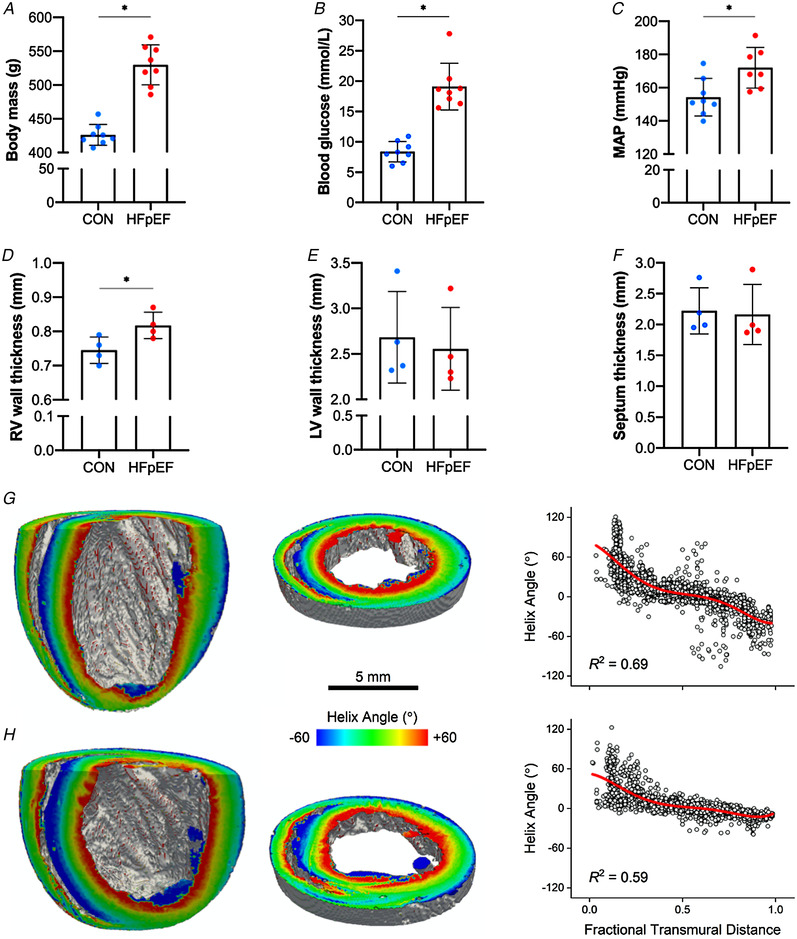
Figure 1. Cardiometabolic characteristics.

At 20 weeks of age, HFpEF rats developed obesity (426.25 ± 15.41 vs. 529.88 ± 29.56 g P < 0.001) (A), hyperglycaemia (8.38 ± 1.69 vs. 19.10 ± 3.83 mmol l−1; P < 0.001) (B) and hypertension (154.26 ± 11.28 vs. 172.03 ± 12.26 mmHg; P = 0.012) (C). Compared with lean controls, obese‐HFpEF rats also showed increased right ventricular (RV) wall thickness (0.74 ± 0.04 vs. 0.82 ± 0.04 mm; P = 0.034) (D); however, left ventricular (LV) wall and the septum thickness were not different between groups (2.68 ± 0.51 vs. 2.55 ± 0.46 mm; P = 0.719 and 2.22 ± 0.38 vs. 2.16 ± 0.49 mm; P = 0.849, respectively) (E–F). Left and middle panels: long axis cuts (left) and short axis slices (middle) of representative lean (G) and obese (H) hearts, with myocyte helix (inclination) angle colour coded on the cut surfaces. Right panel: the helix angle in the RV free wall plotted as a function of fractional transmural distance (0.0, endocardium; 1.0, epicardium) for representative lean (G) and obese (H) hearts. The red continuous line is a 5th order polynomial fit to the data. Myocyte disarray is quantified by the R 2 of this fit. [Color figure can be viewed at wileyonlinelibrary.com]
