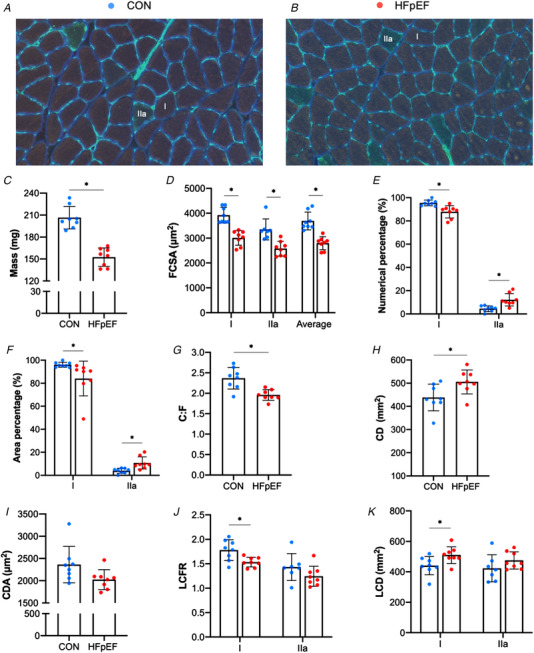
Figure 2. Histological features of the soleus muscle.

Representative soleus sections from control (A) and obese‐HFpEF (B). Obese‐HFpEF showed atrophy in the soleus muscle, with reduced wet muscle mass (206.54 ± 15.48 vs. 152.50 ± 12.55 mg; P < 0.001) (C) and reduced cross‐sectional area (CSA) in both Type I (3921.88 ± 316.51 vs. 3009.75 ± 298.03 μm2; P < 0.001) and Type IIa fibres (3351.43 ± 422.09 vs. 2575.69 ± 296.86 μm2; P = 0.001) (D). HFpEF rats also had a lower numerical and areal composition of Type I fibres (95.49 ± 2.45 vs. 87.84 ± 5.32%, P = 0.002 and 96.06 ± 2.17 vs. 84.06 ± 15.14 %, P = 0.043, respectively), whereas these were higher in Type IIa fibres (4.51 ± 2.45 vs. 12.16 ± 5.32 %, P = 0.002 and 3.94 ± 2.17 vs. 10.74 ± 5.31 %, P = 0.005, respectively) (E‐F). Moreover, compared with lean controls, obese rats had reduced capillary‐to‐fibre (C:F) ratio (2.37 ± 0.26 vs. 1.96 ± 0.13; P = 0.002) (G), whereas capillary density (CD), was increased (438.23 ± 57.66 vs. 505.5 ± 51.53 mm−2; P = 0.027) (H) with no change in capillary domain area (CDA) (2363.28 ± 410.48 vs. 2024.48 ± 223.24 μm2; P = 0.059) (I). Finally, local analyses of capillary distribution showed that HFpEF rats had lower local capillary‐to‐fibre ratio (LCFR) in Type I fibres (1.78 ± 0.22 vs. 1.53 ± 0.10; P = 0.011), although this was unchanged in Type IIa fibres (1.43 ± 0.27 vs. 1.24 ± 0.21; P = 0.154) (J). In contrast, local capillary density (LCD) in Type I fibres was increased in HFpEF rats (440.41 ± 59.71 vs. 510.15 ± 54.9 mm−2; P = 0.029), with no changes in Type IIa fibres (423.20 ± 88.64 vs. 474.73 ± 56.17 mm−2; P = 0.196) (K). [Color figure can be viewed at wileyonlinelibrary.com]
